What the wider credit card margin costs in each state
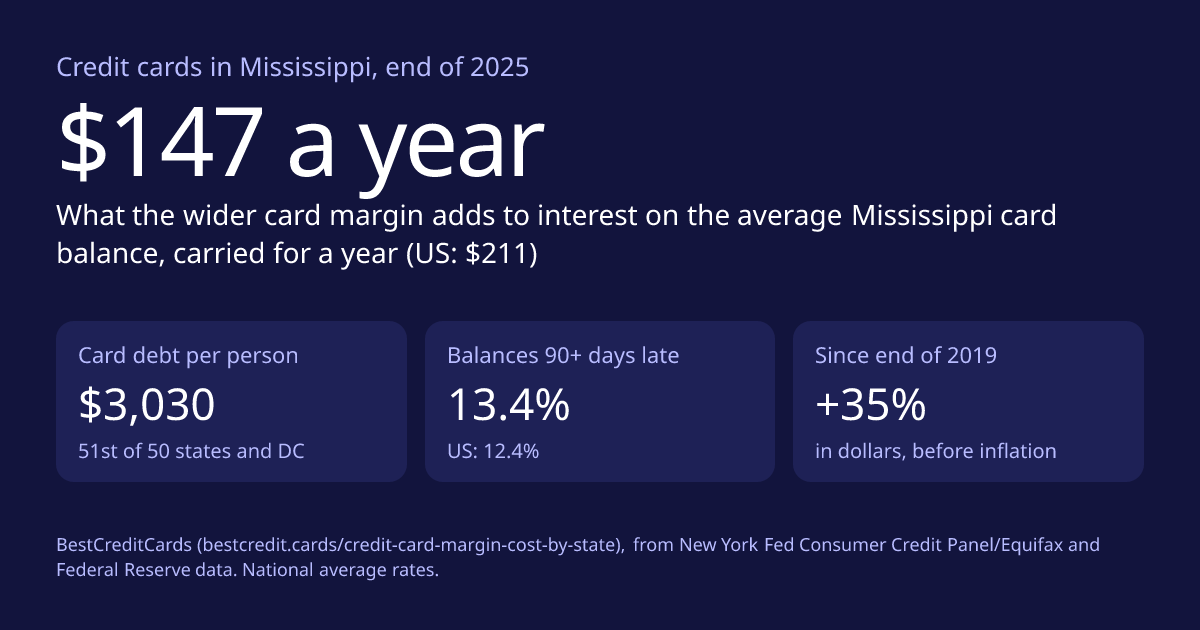
The average American with a credit report owed $4,350 on credit cards at the end of 2025. Carried for a year at the average card APR of 22.30% (the Federal Reserve’s November 2025 survey), that costs $970 in interest, and $211 of it comes from card issuers’ margin over the prime rate having widened by 4.85 percentage points in the ten years since November 2015. In Alaska, where card debt per person is highest of the 50 states, the margin’s widening costs $255 a year; in Mississippi, lowest, $147. Since then the margin has widened further, to 15.61 points in August 2026, a record.
Key findings
- $211 a year: what the card margin’s widening in the ten years to November 2025 adds to interest on the average US card balance ($4,350 per person at the end of 2025), if it is carried for a year at that month’s average APR of 22.30%. Since then the margin has widened further, to 15.61 points in August 2026, a record.
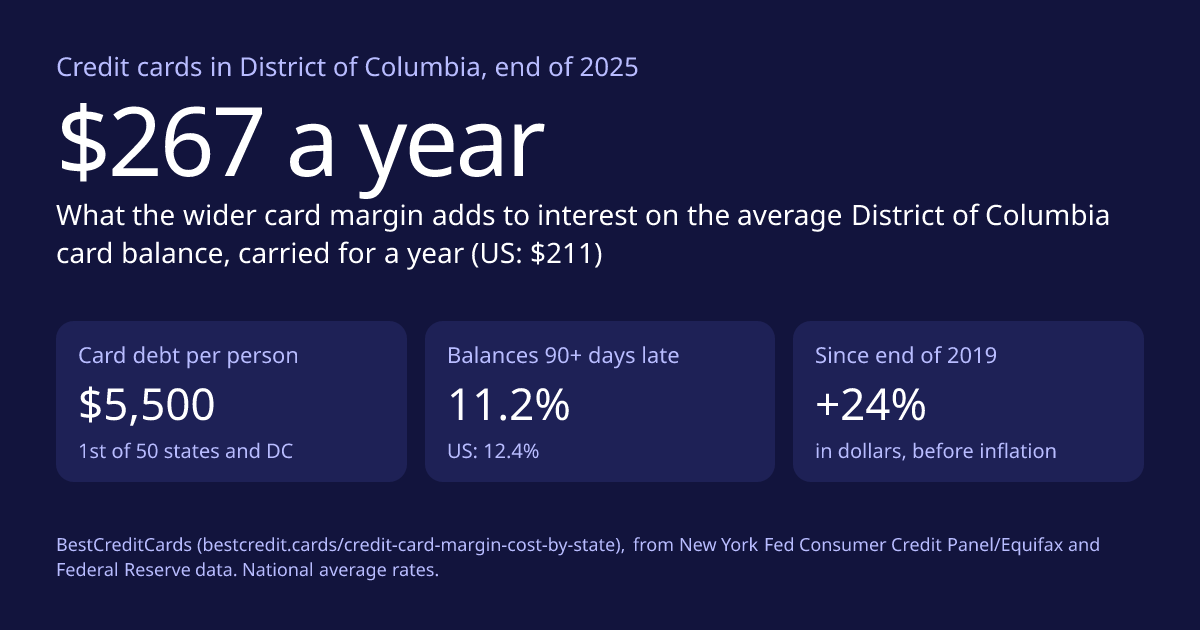
- Most card debt per person: District of Columbia ($5,500); among the 50 states, Alaska ($5,250). Least: Mississippi ($3,030).
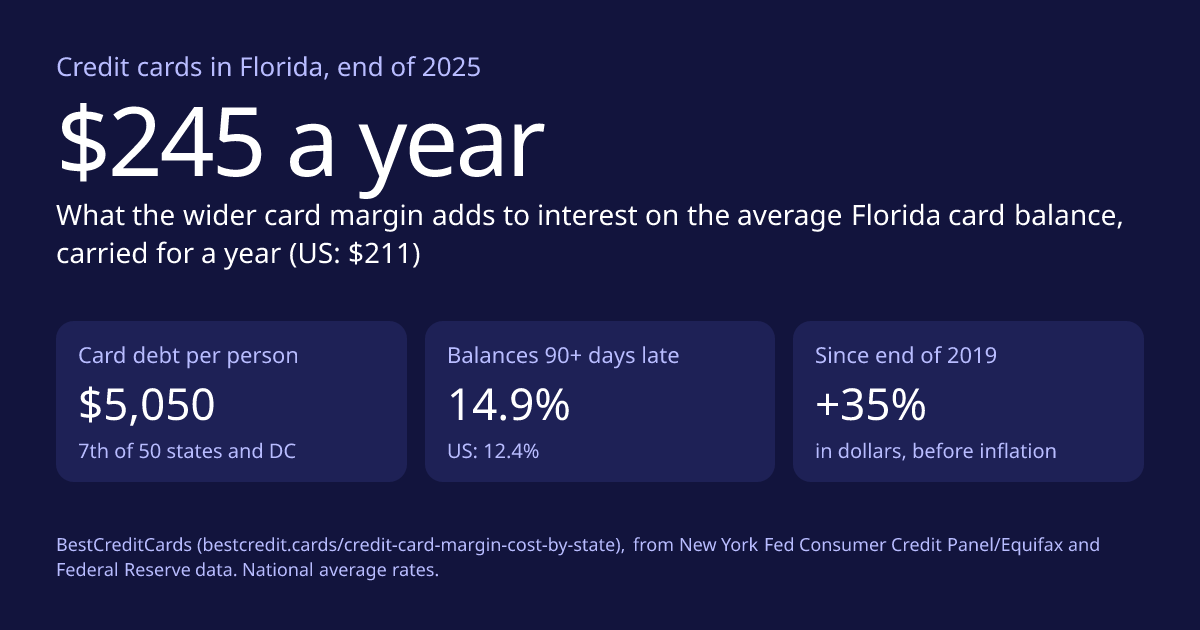
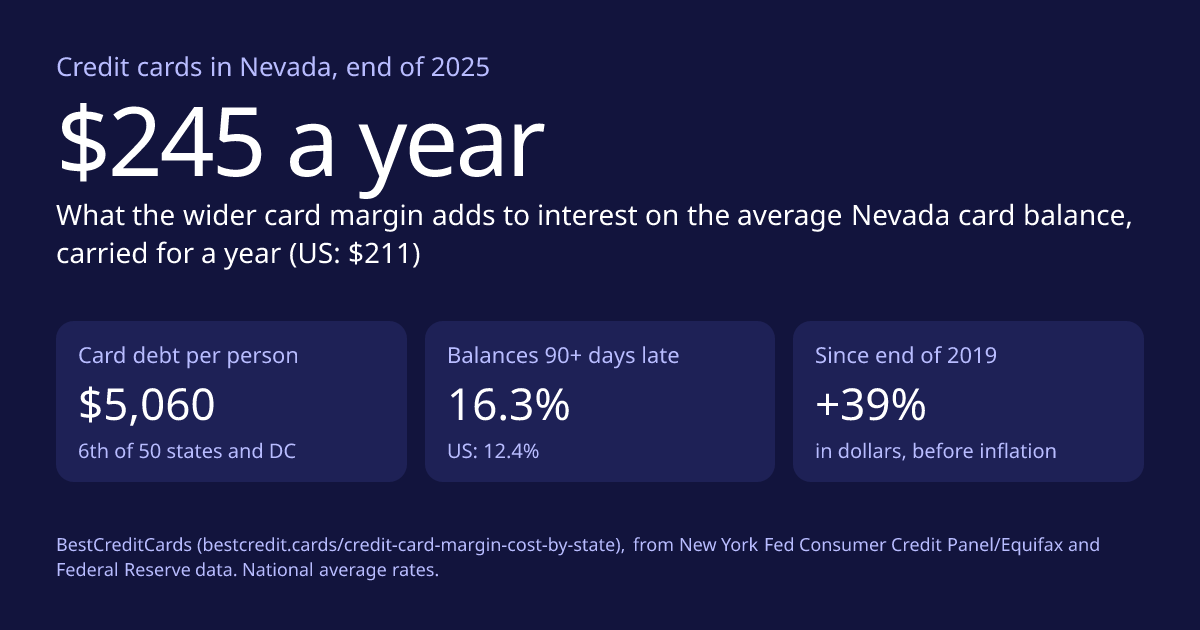
- Seriously late: 12.4% of US card balances were 90 or more days past due at the end of 2025. The highest share was in Nevada (16.3%), then Florida (14.9%) and Louisiana (14.2%).
- Since the end of 2019: card debt per person rose 28.3% nationally, or 1.8% after inflation. It rose most in Nevada (+39.4%), South Carolina (+35.4%) and Florida (+35.4%), in dollars.
- A record in dollars, not after inflation: card debt per person is at its highest in dollars in every state and DC since the New York Fed’s state figures begin (2003). After inflation, none is at a record: the US average is 23.1% below its peak at the end of 2008 ($5,660 in 2025 dollars), and of the 50 states and DC, 40 peaked in 2008, 7 peaked in 2003, and 4 peaked in 2004.
For journalists: find your state’s figures as sentences you can paste, download every figure and an image for each state, or see our press page. Questions: team@bestcredit.cards.
Your state
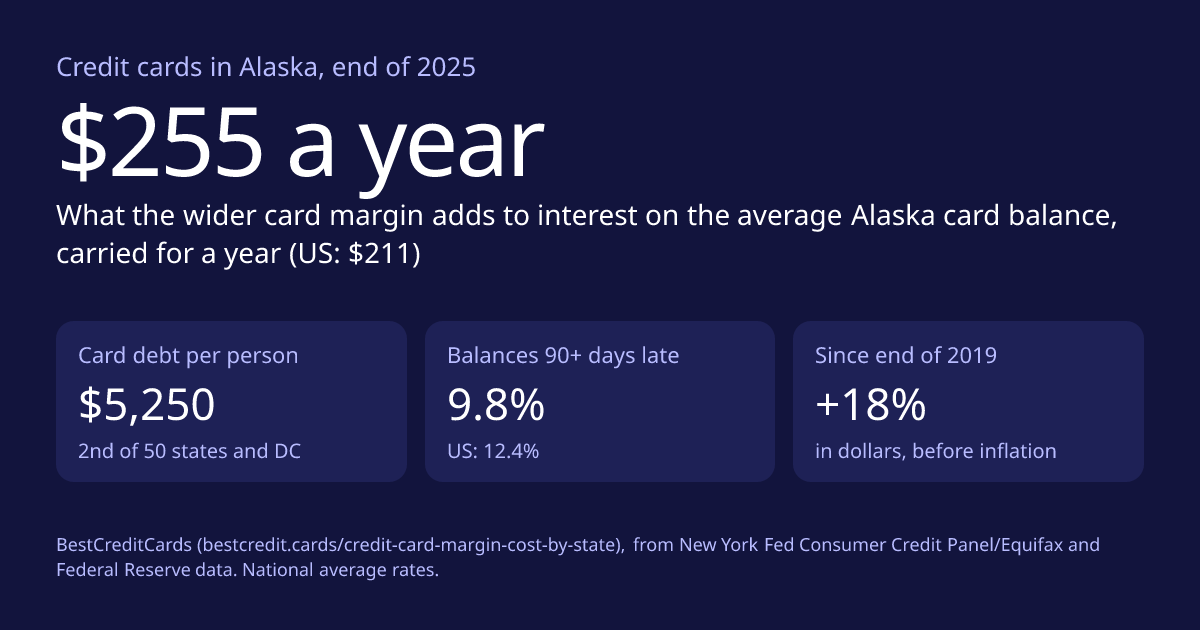
- Alaska ranks 2nd of the 50 states and DC for credit card debt per person: $5,250 at the end of 2025, above the US average of $4,350.
- Card debt per person in Alaska is up 18.2% since the end of 2019, or down 6.2% after inflation (US: up 28.3%, or up 1.8% after inflation).
- That is a record in dollars for Alaska in New York Fed data going back to 2003, but after inflation it is 30.3% below its peak, at the end of 2004.
- 9.8% of Alaska’s card balances were 90 or more days past due, the 40th highest share of the 50 states and DC, against 12.4% nationally.
- On the average balance carried for a year, the wider card margin adds $255 a year in interest in Alaska (US: $211), because issuers’ average margin over the prime rate was 4.85 percentage points wider in November 2025 than in November 2015.
- Alaska has the highest card debt per person of the 13 states in the West.
- Alaska
- United States
Source: Federal Reserve Bank of New York, Consumer Credit Panel / Equifax. End-of-year balances per person with a credit report, in dollars of each year (not adjusted for inflation).
- under $171
- $171 to under $187
- $187 to under $207
- $207 to under $234
- $234 or more
Source: Federal Reserve Bank of New York, State Level Household Debt Statistics 2003-2025, Federal Reserve Bank of New York, February 2026 (Consumer Credit Panel / Equifax); Federal Reserve G.19 and H.15; BestCreditCards calculations. Shades split the states into five groups of about ten.
Which states have the most credit card debt per person?
District of Columbia has the most credit card debt per person, $5,500 at the end of 2025, and Mississippi the least, $3,030. The table ranks every state by debt per person, which also orders the interest it costs: the rate is the same national average for everyone. For the national picture, see US credit card debt totals and trends; the report explains which balances each series includes.
| Rank | State | Card debt per person | Change since 2019 | After inflation | 90+ days late | Interest a year at 22.30% | Of which, the margin’s widening |
|---|---|---|---|---|---|---|---|
| 1 | District of Columbia | $5,500 | +24.4% | -1.3% | 11.2% | $1,227 | $267 |
| 2 | Alaska | $5,250 | +18.2% | -6.2% | 9.8% | $1,171 | $255 |
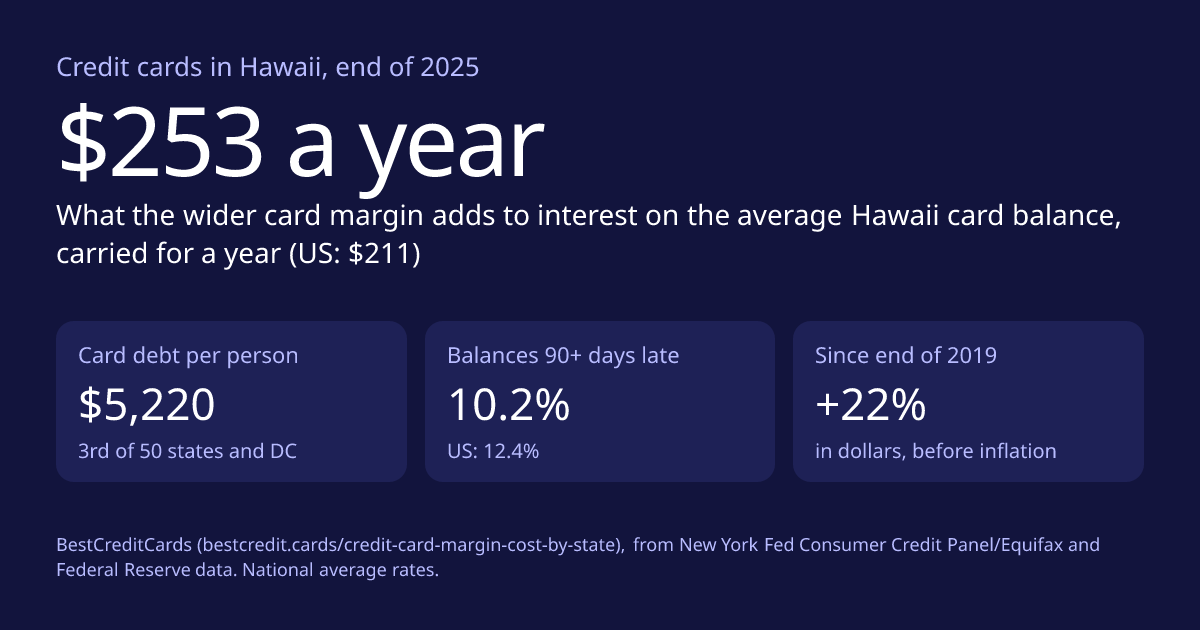
| 3 | Hawaii | $5,220 | +21.7% | -3.5% | 10.2% | $1,164 | $253 |
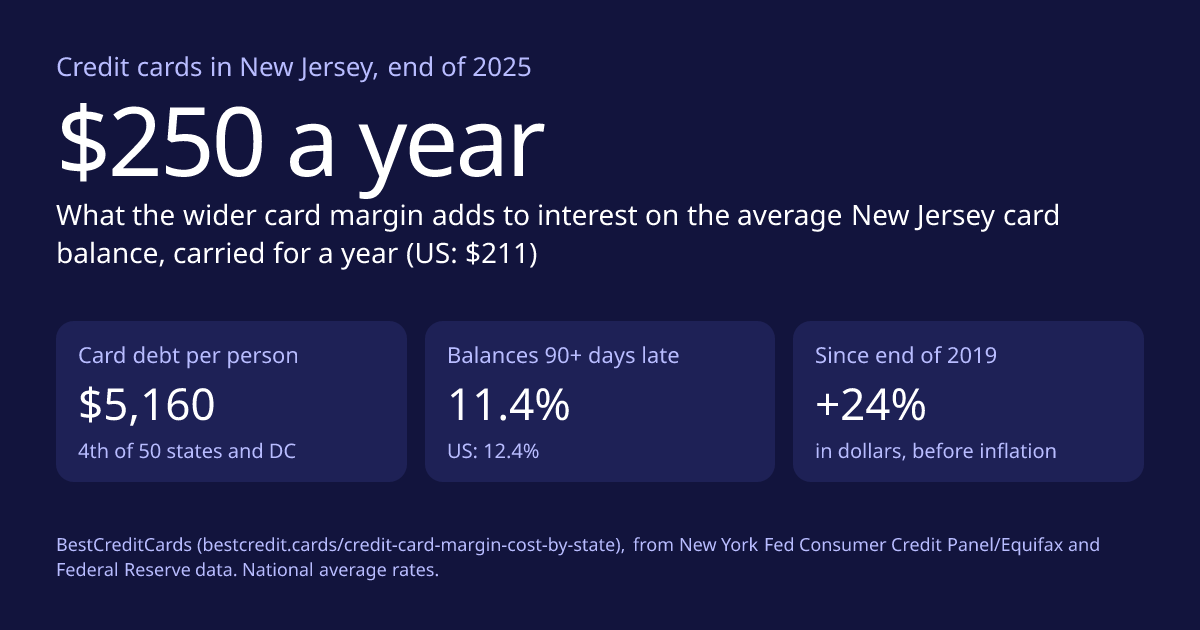
| 4 | New Jersey | $5,160 | +23.7% | -1.8% | 11.4% | $1,151 | $250 |
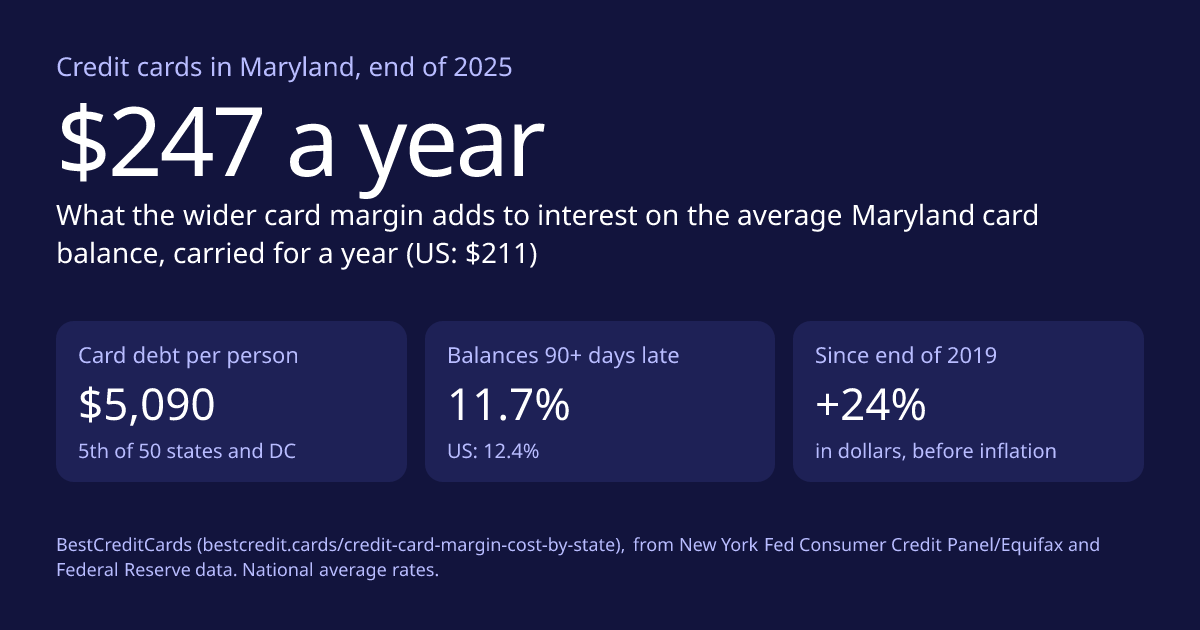
| 5 | Maryland | $5,090 | +23.5% | -2.0% | 11.7% | $1,135 | $247 |
| 6 | Nevada | $5,060 | +39.4% | +10.6% | 16.3% | $1,128 | $245 |
| 7 | Florida | $5,050 | +35.4% | +7.4% | 14.9% | $1,126 | $245 |
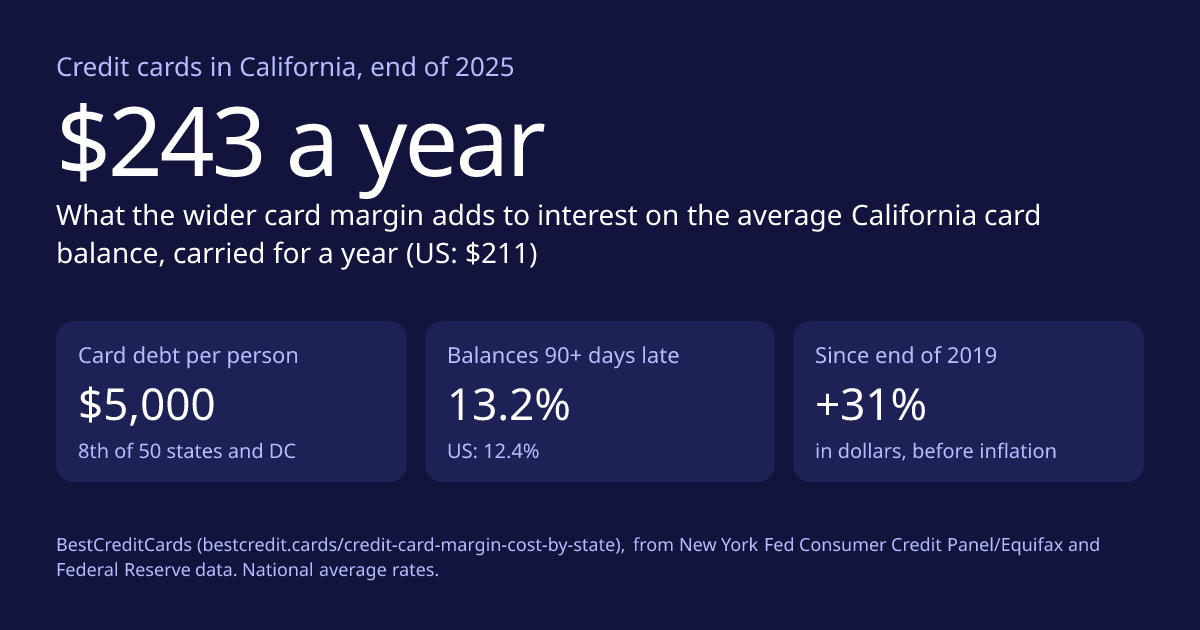
| 8 | California | $5,000 | +31.2% | +4.1% | 13.2% | $1,115 | $243 |
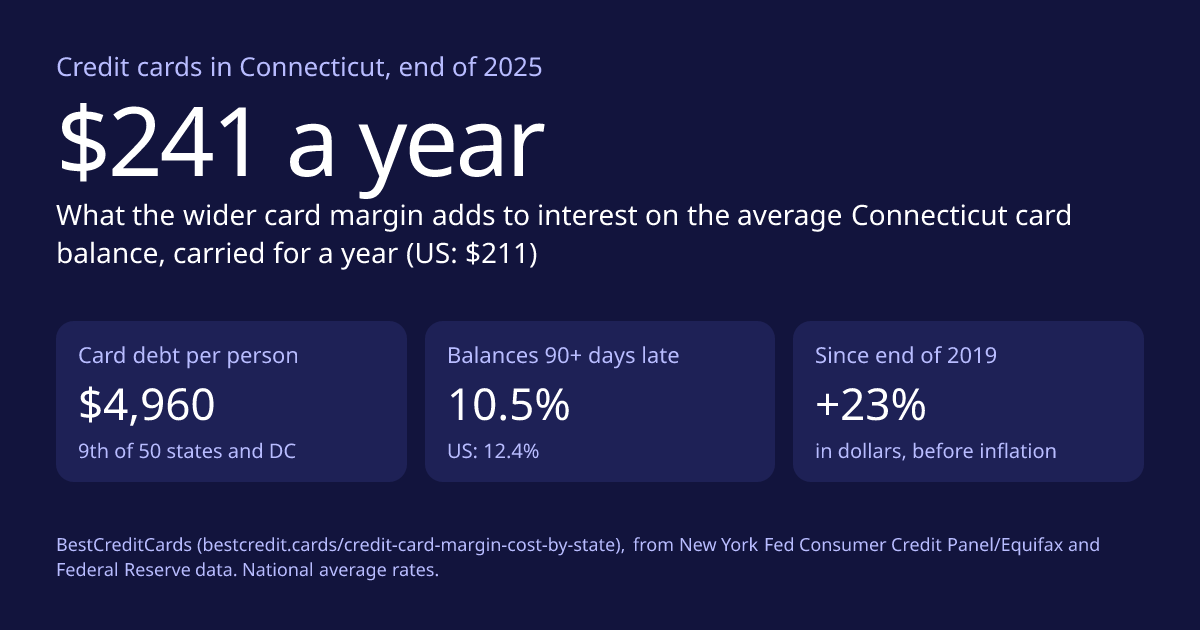
| 9 | Connecticut | $4,960 | +23.4% | -2.1% | 10.5% | $1,106 | $241 |
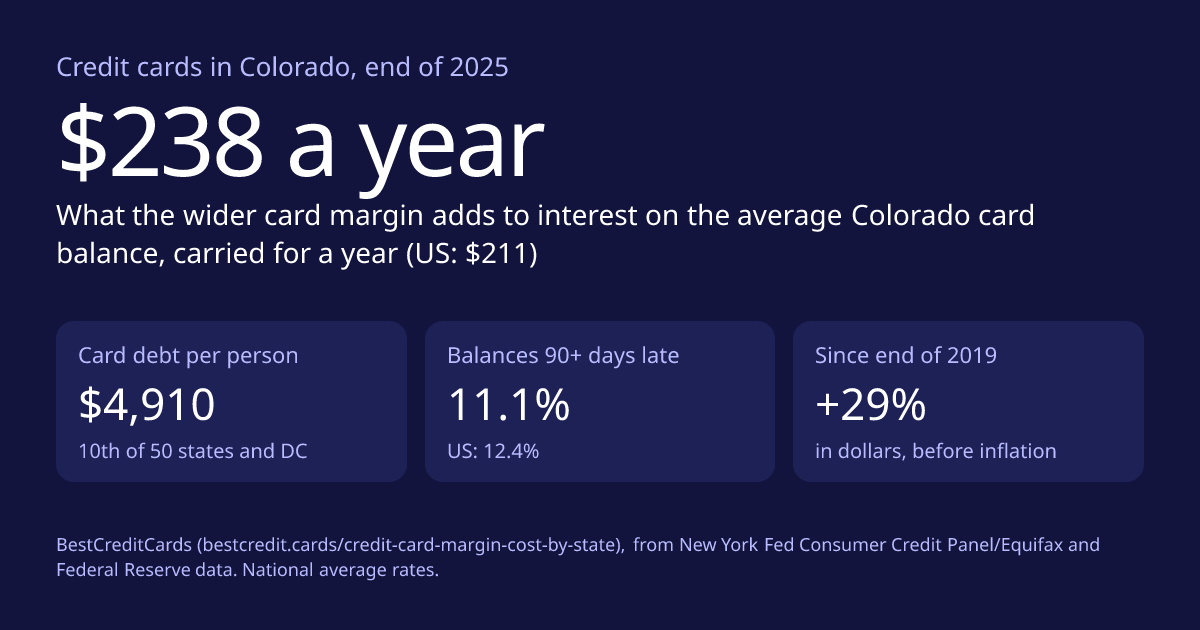
| 10 | Colorado | $4,910 | +28.5% | +2.0% | 11.1% | $1,095 | $238 |
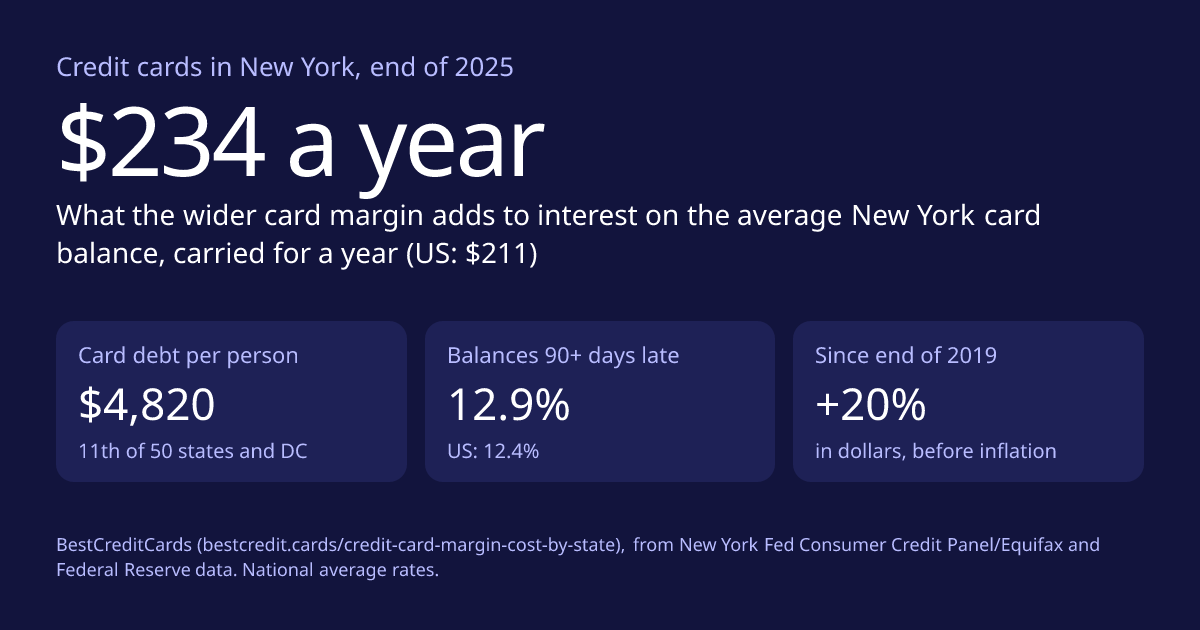
| 11 | New York | $4,820 | +20.2% | -4.6% | 12.9% | $1,075 | $234 |
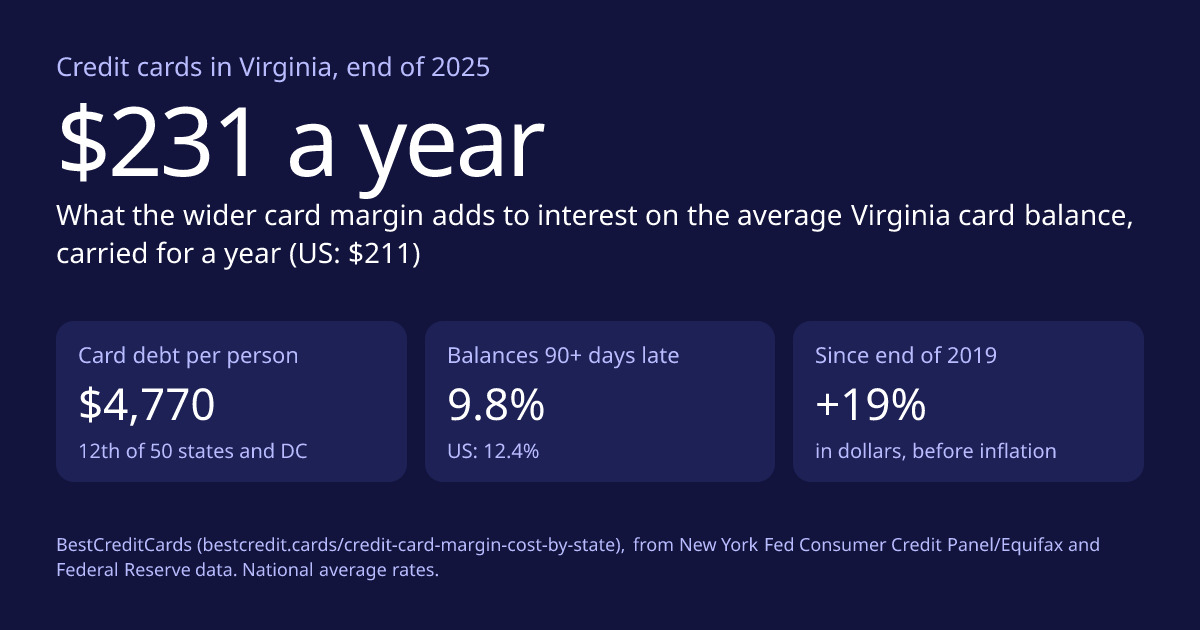
| 12 | Virginia | $4,770 | +19.3% | -5.4% | 9.8% | $1,064 | $231 |
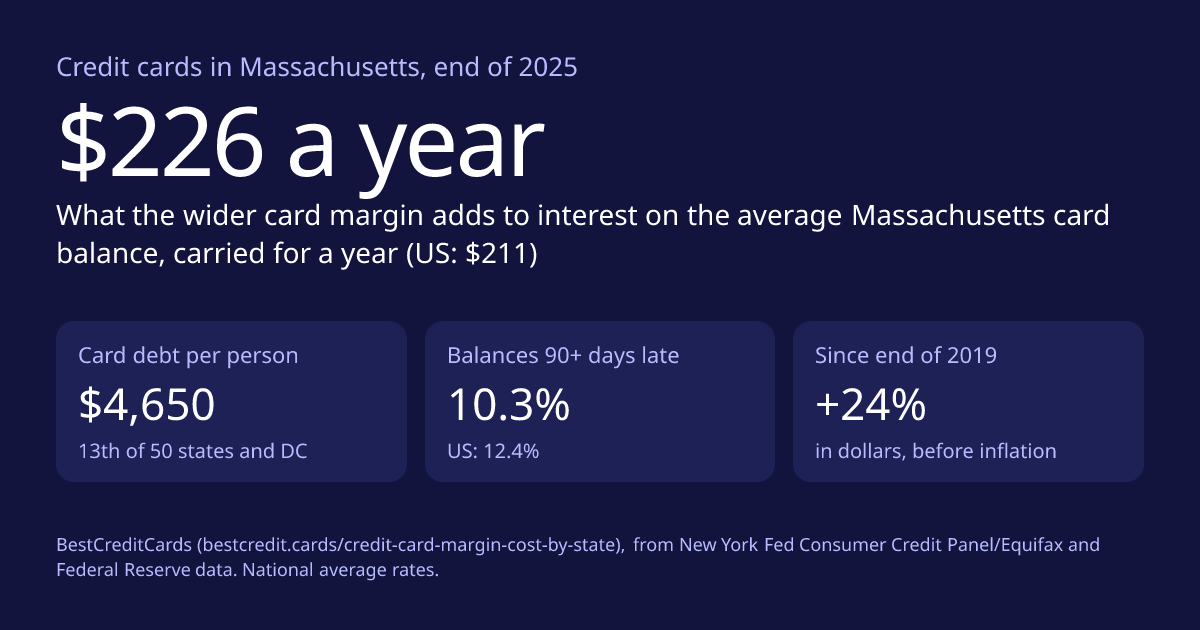
| 13 | Massachusetts | $4,650 | +23.7% | -1.9% | 10.3% | $1,037 | $226 |
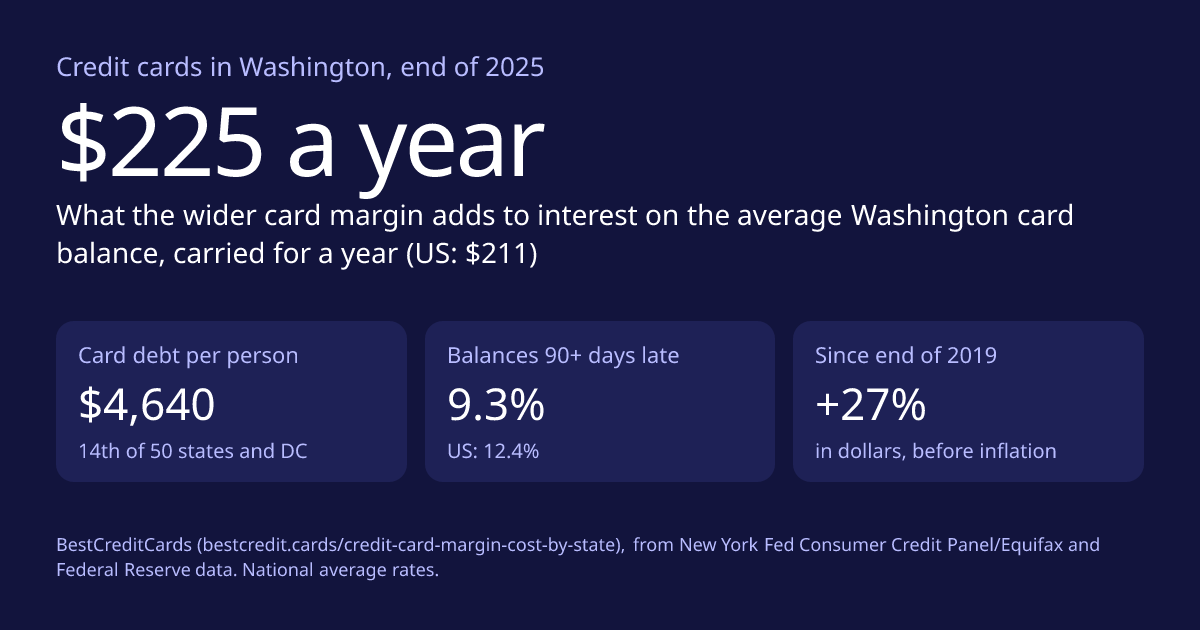
| 14 | Washington | $4,640 | +26.8% | +0.6% | 9.3% | $1,035 | $225 |
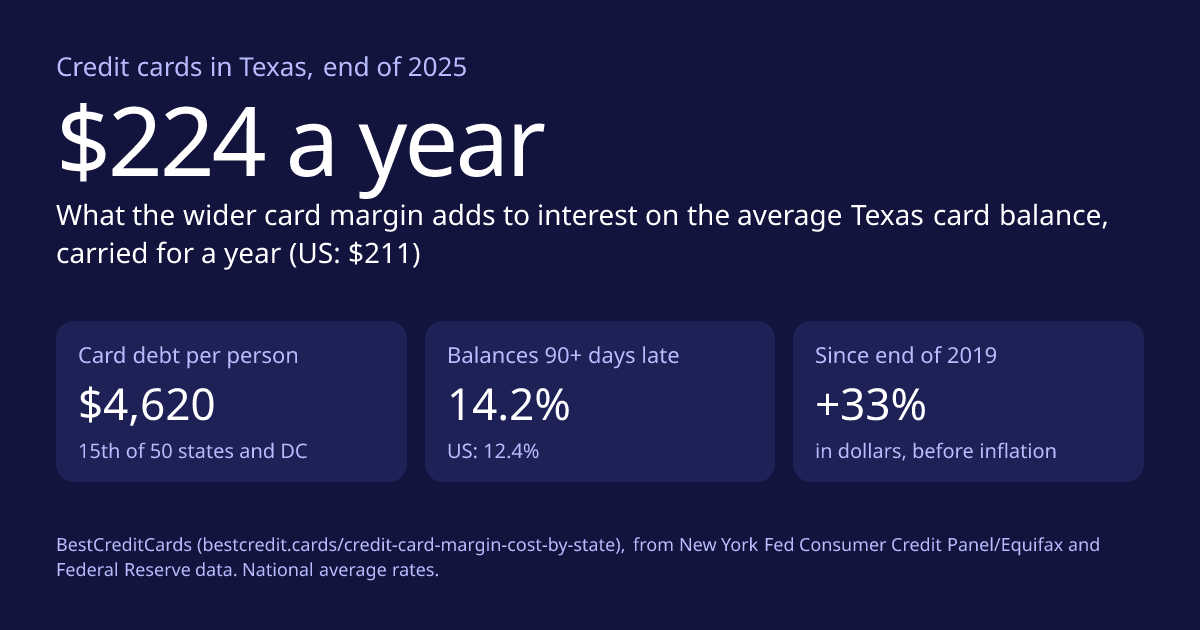
| 15 | Texas | $4,620 | +33.1% | +5.6% | 14.2% | $1,030 | $224 |
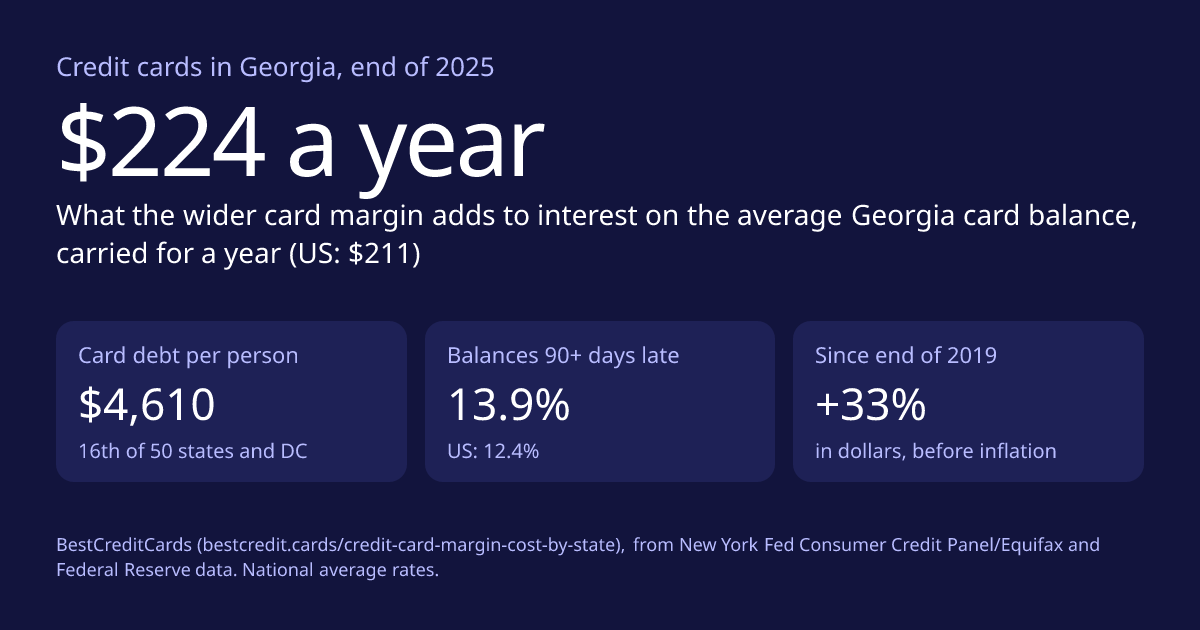
| 16 | Georgia | $4,610 | +32.9% | +5.4% | 13.9% | $1,028 | $224 |
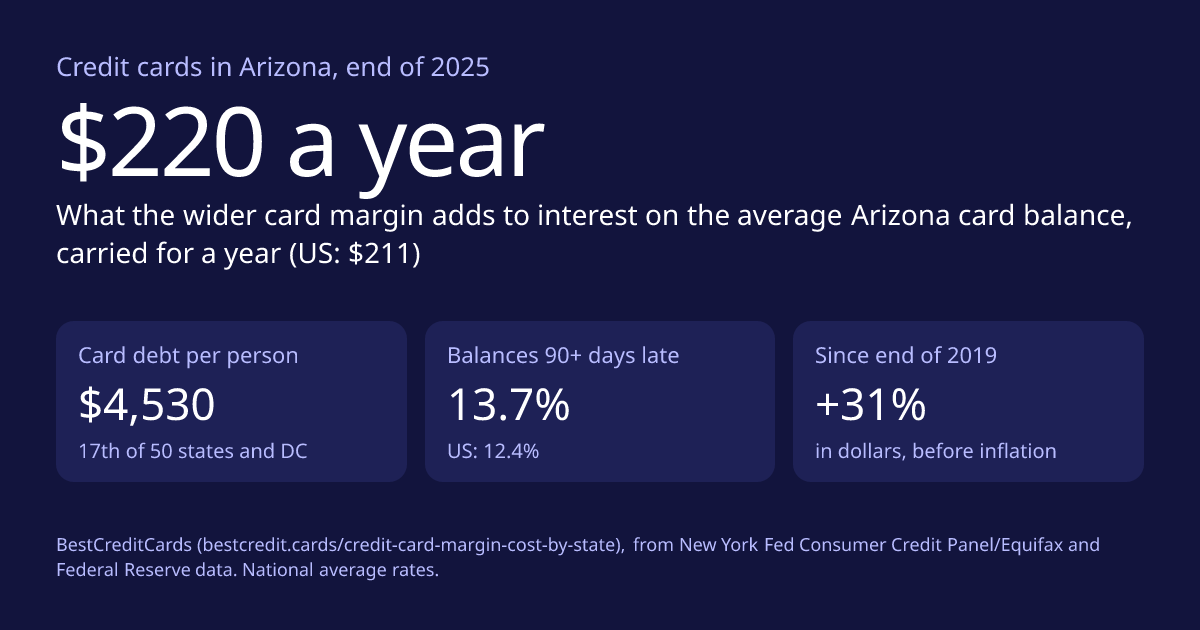
| 17 | Arizona | $4,530 | +30.9% | +3.9% | 13.7% | $1,010 | $220 |
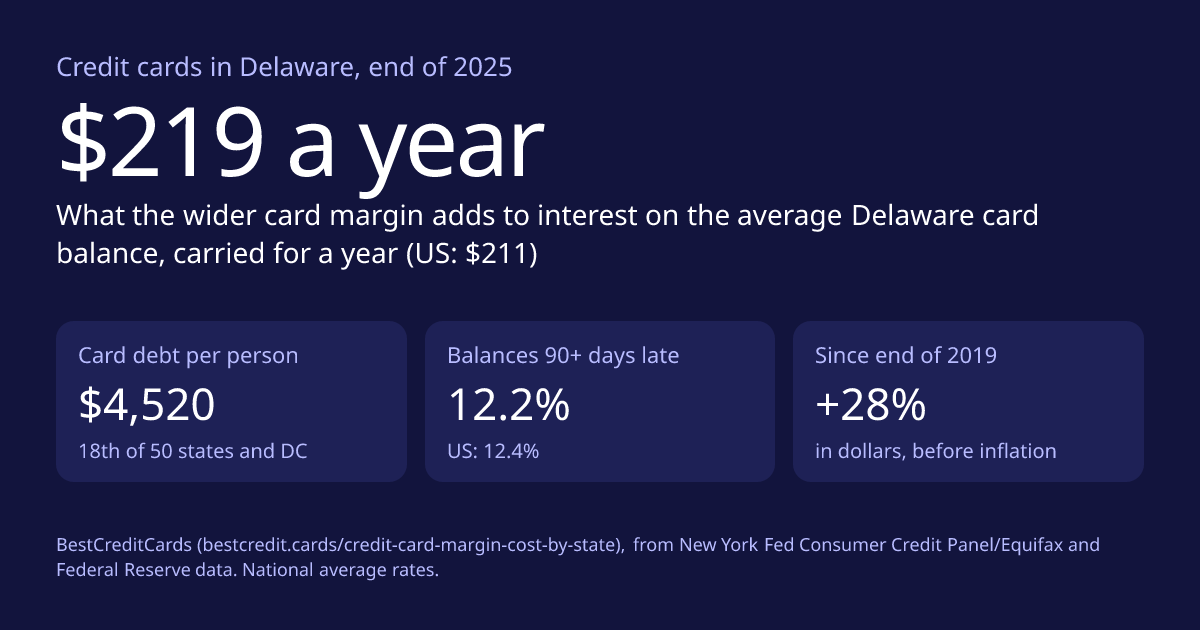
| 18 | Delaware | $4,520 | +28.4% | +1.9% | 12.2% | $1,008 | $219 |
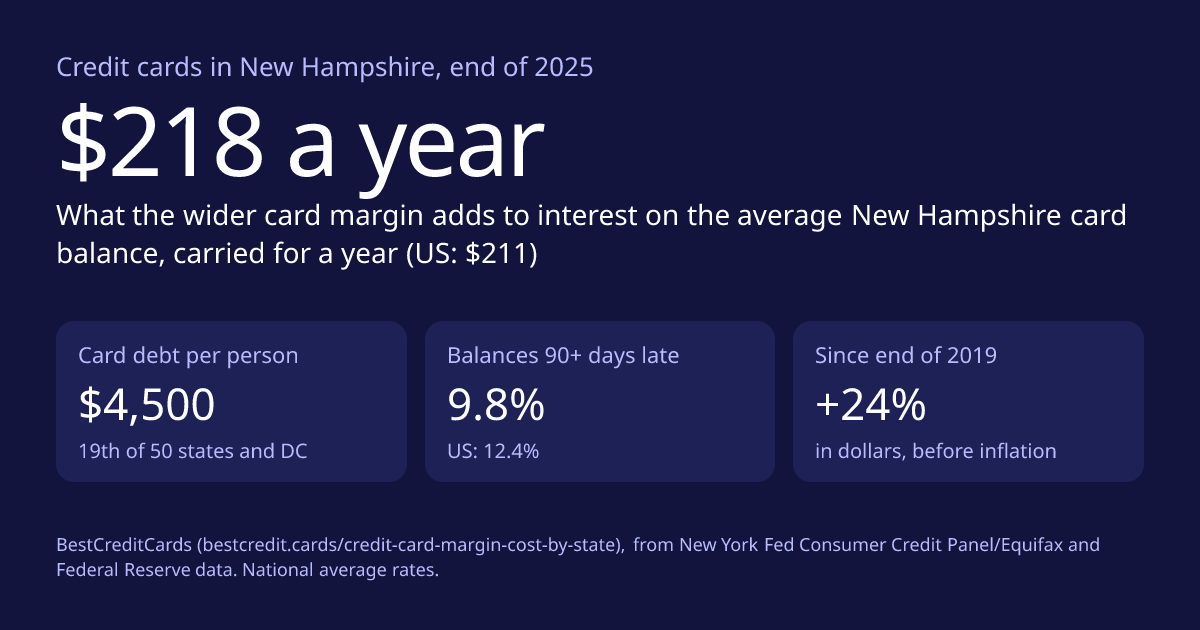
| 19 | New Hampshire | $4,500 | +24.0% | -1.7% | 9.8% | $1,004 | $218 |
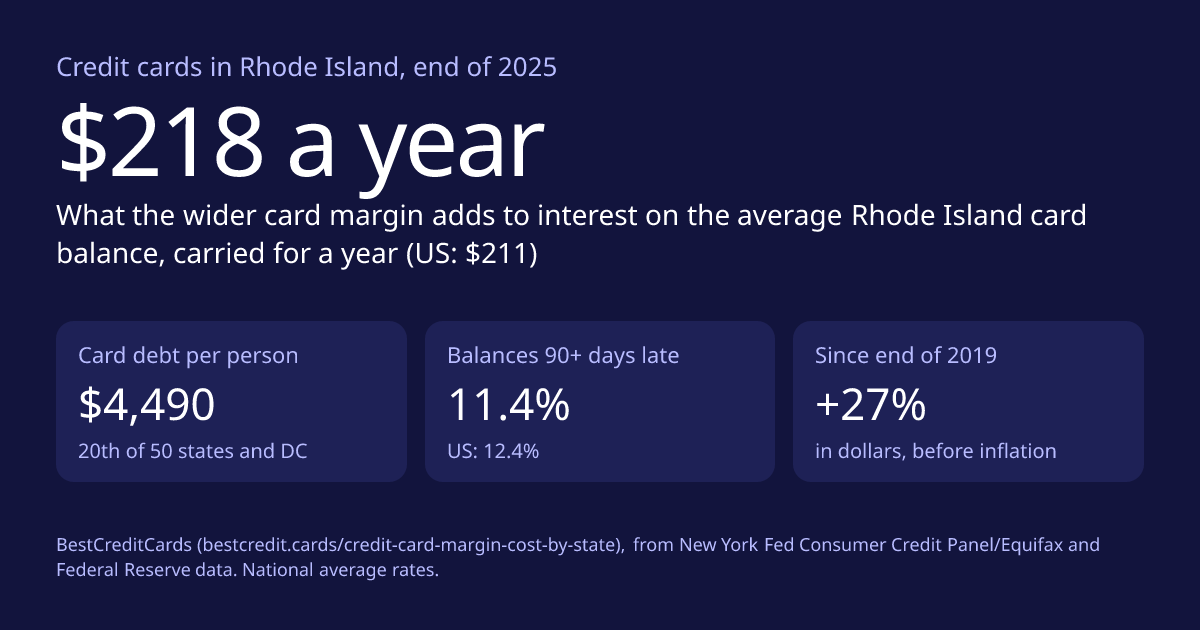
| 20 | Rhode Island | $4,490 | +26.8% | +0.6% | 11.4% | $1,001 | $218 |
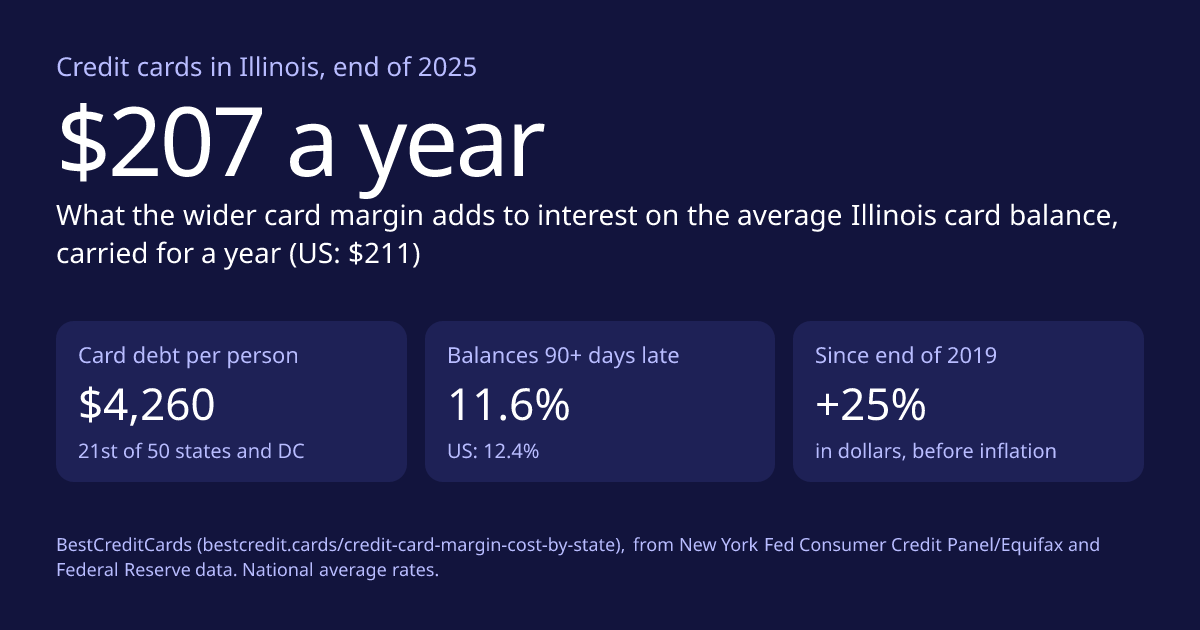
| 21 | Illinois | $4,260 | +24.9% | -0.9% | 11.6% | $950 | $207 |
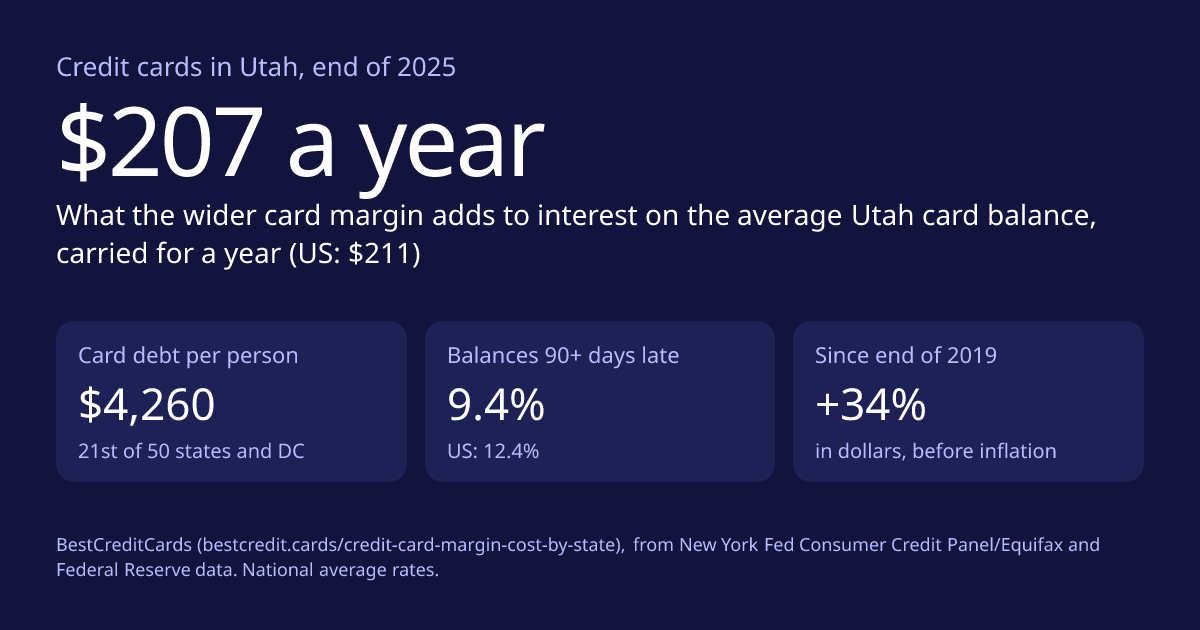
| 21 | Utah | $4,260 | +34.4% | +6.6% | 9.4% | $950 | $207 |
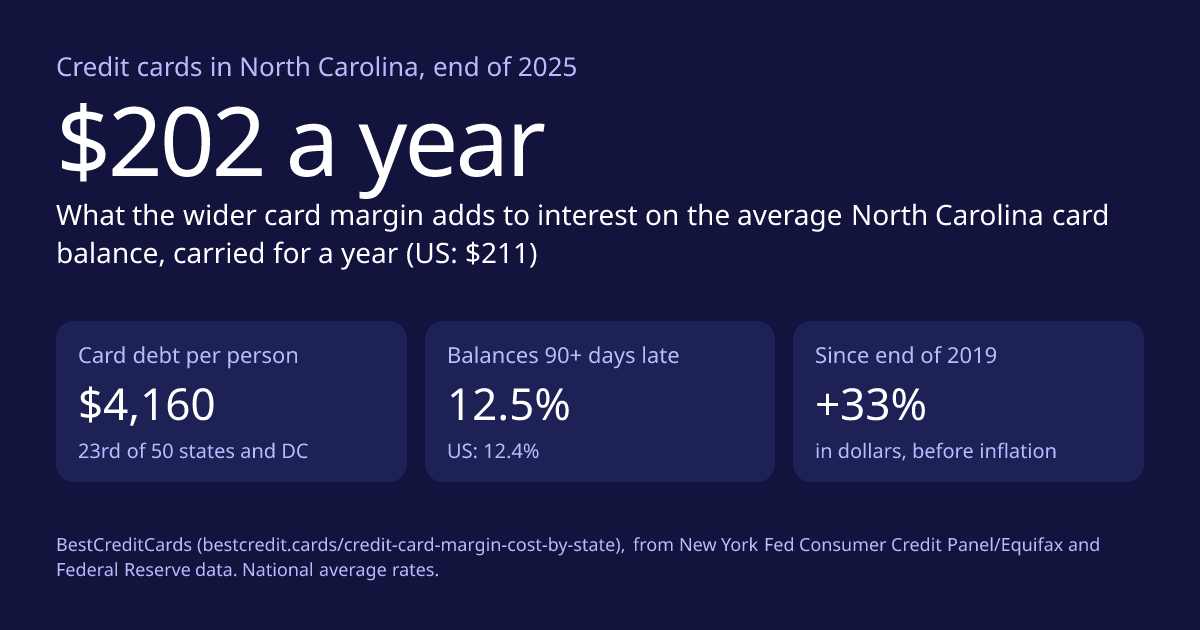
| 23 | North Carolina | $4,160 | +33.3% | +5.8% | 12.5% | $928 | $202 |
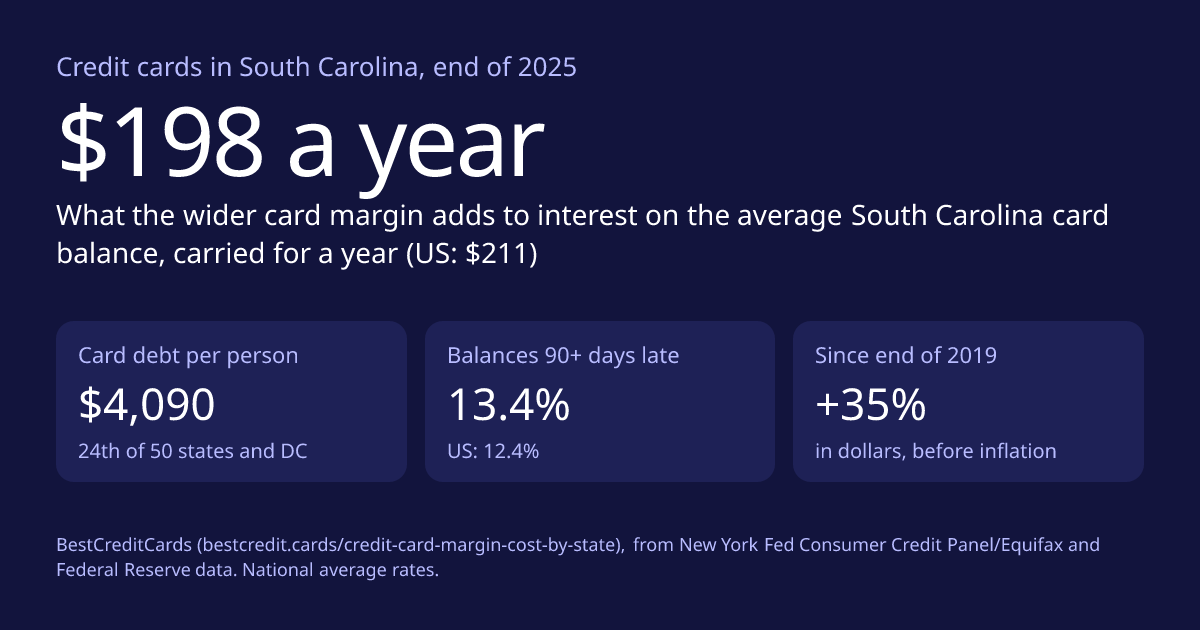
| 24 | South Carolina | $4,090 | +35.4% | +7.4% | 13.4% | $912 | $198 |
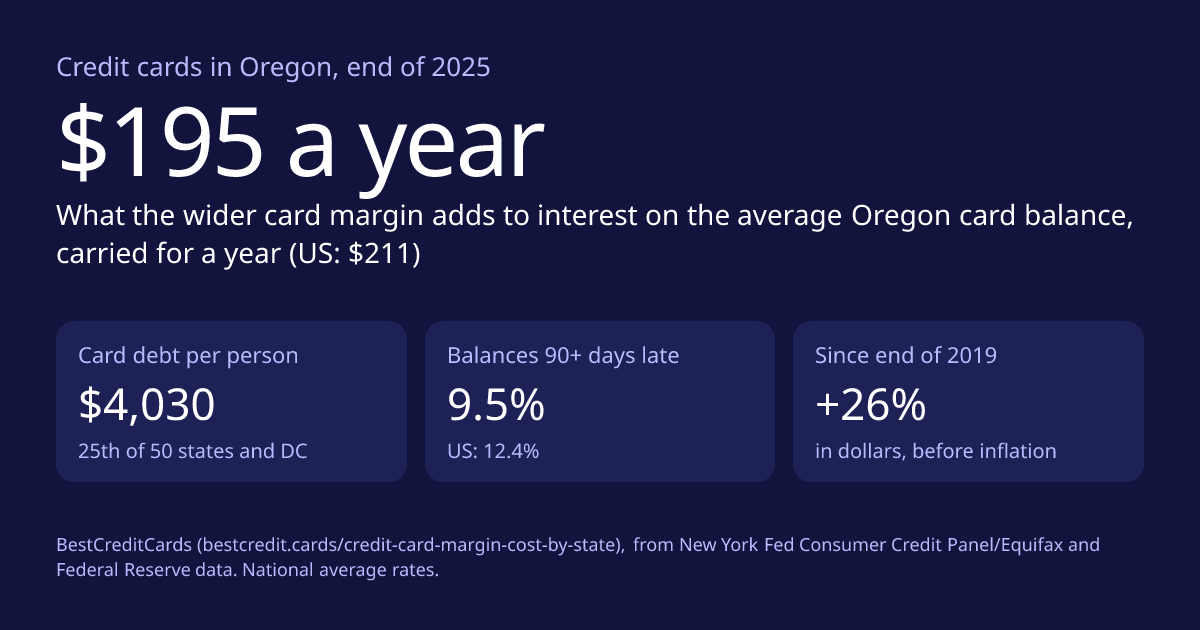
| 25 | Oregon | $4,030 | +25.9% | -0.1% | 9.5% | $899 | $195 |
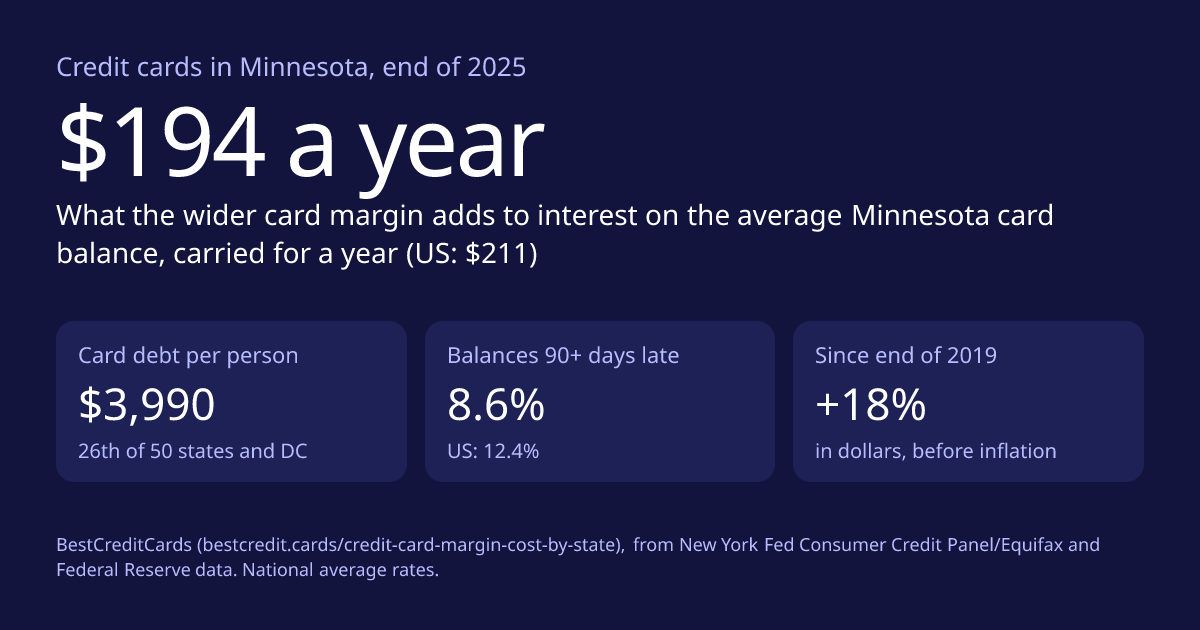
| 26 | Minnesota | $3,990 | +18.0% | -6.4% | 8.6% | $890 | $194 |
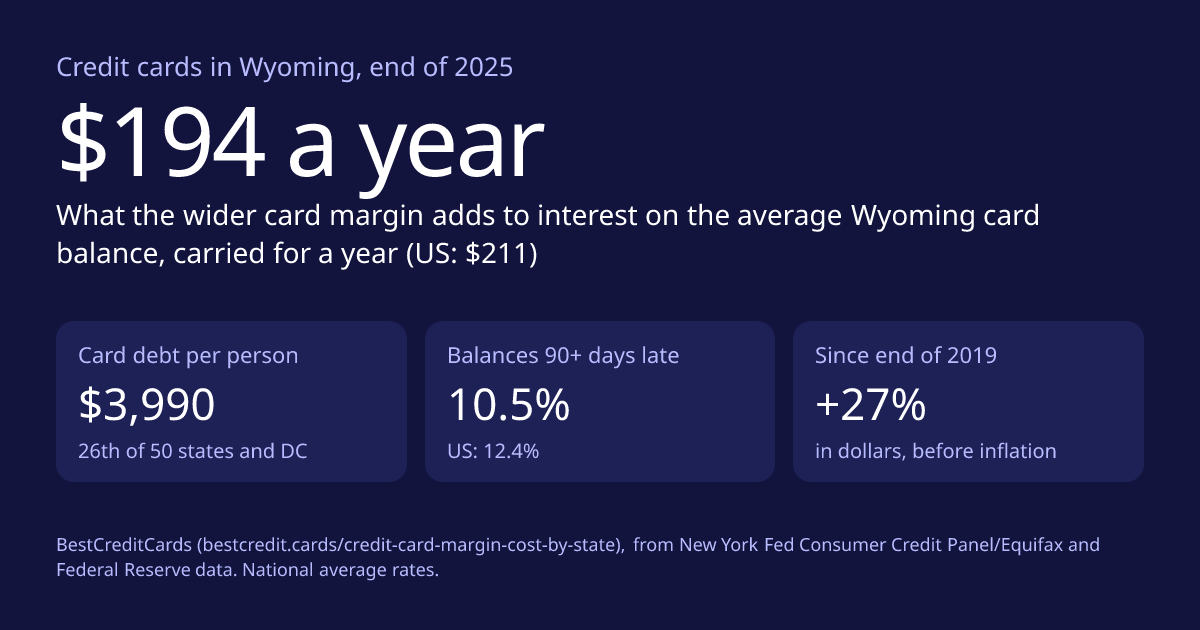
| 26 | Wyoming | $3,990 | +27.5% | +1.1% | 10.5% | $890 | $194 |
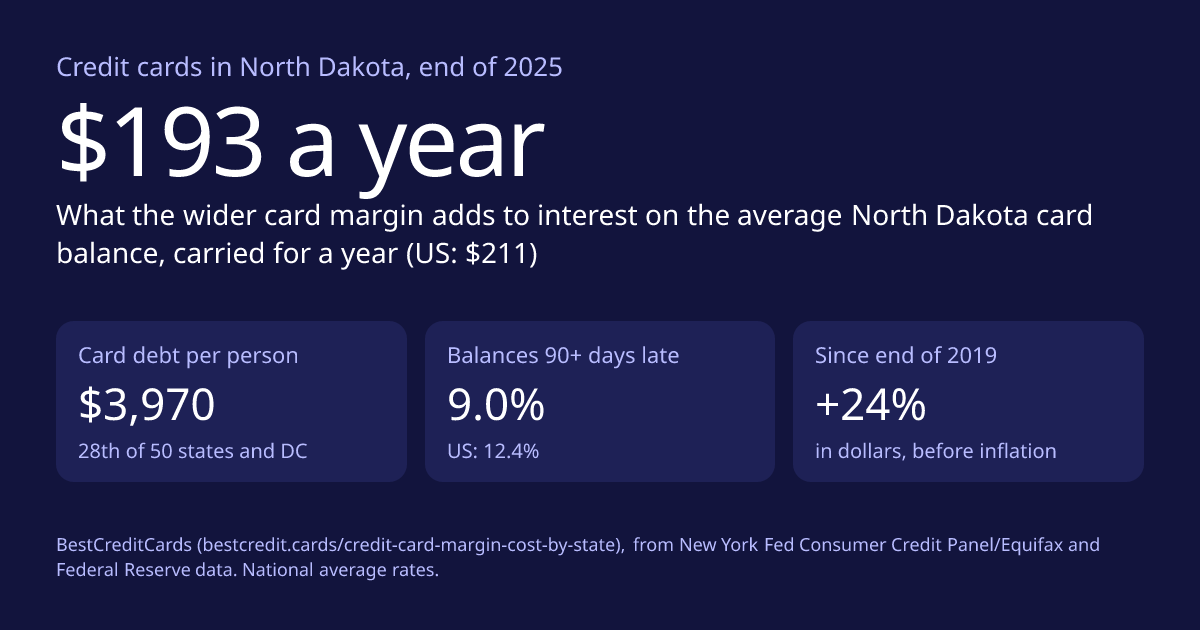
| 28 | North Dakota | $3,970 | +24.1% | -1.6% | 9.0% | $885 | $193 |
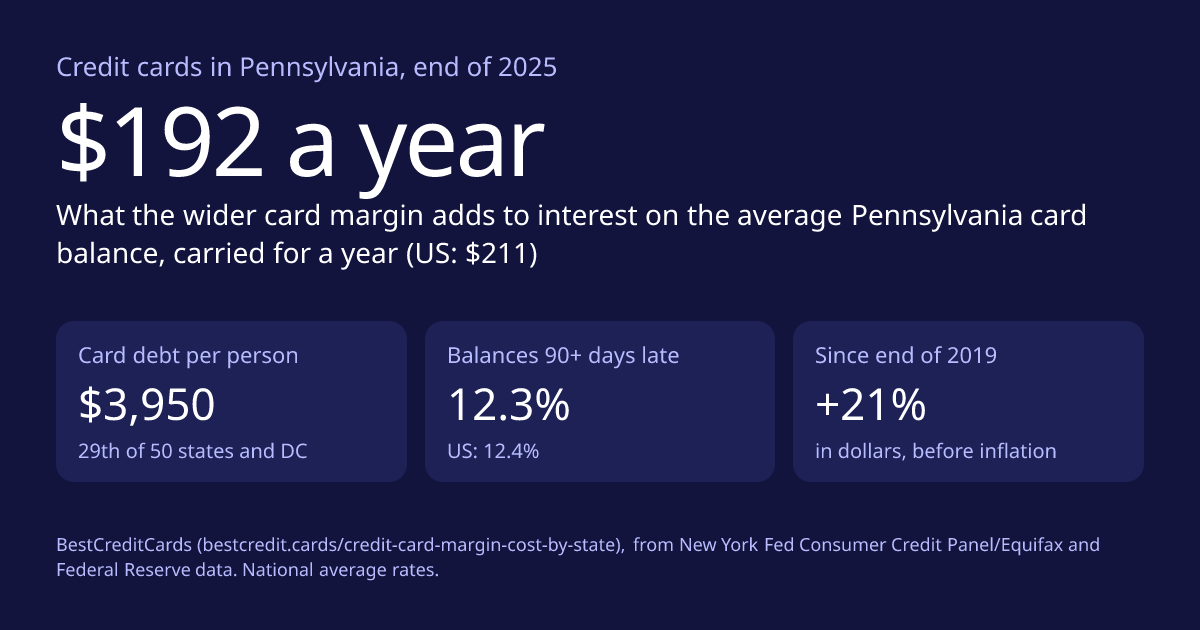
| 29 | Pennsylvania | $3,950 | +21.2% | -3.9% | 12.3% | $881 | $192 |
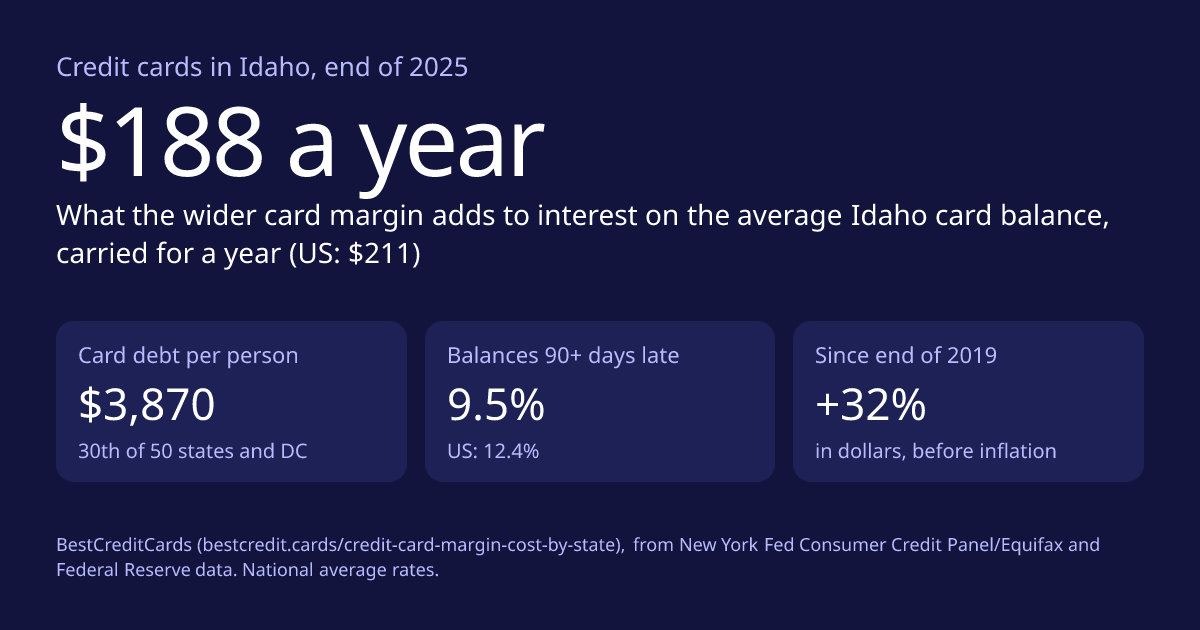
| 30 | Idaho | $3,870 | +32.1% | +4.8% | 9.5% | $863 | $188 |
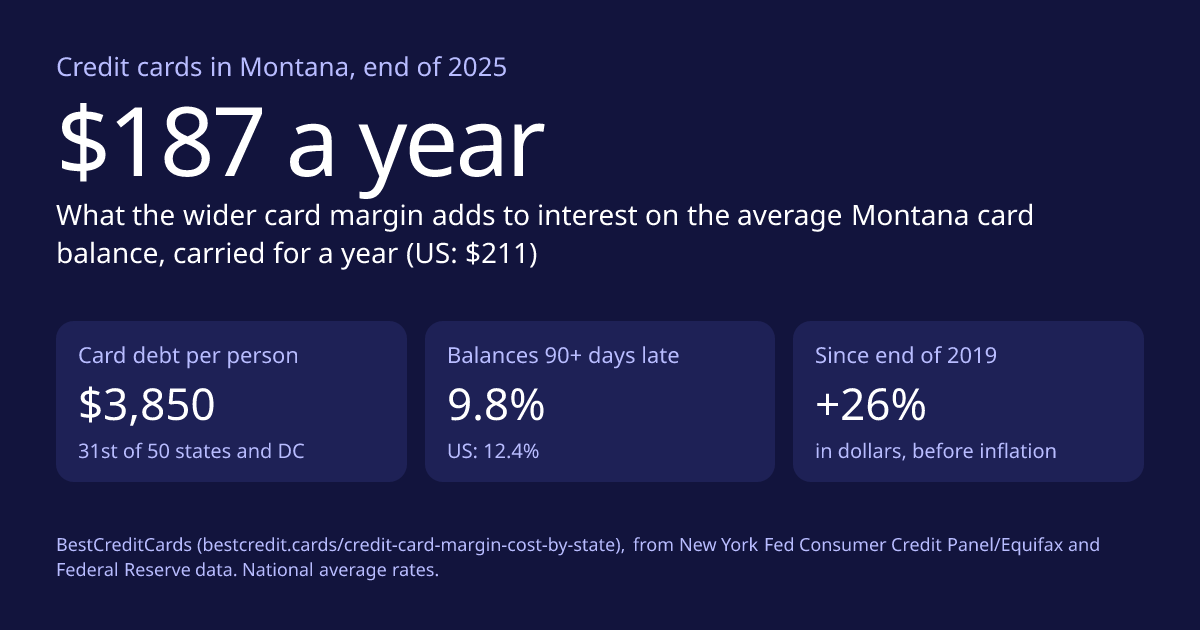
| 31 | Montana | $3,850 | +25.8% | -0.2% | 9.8% | $859 | $187 |
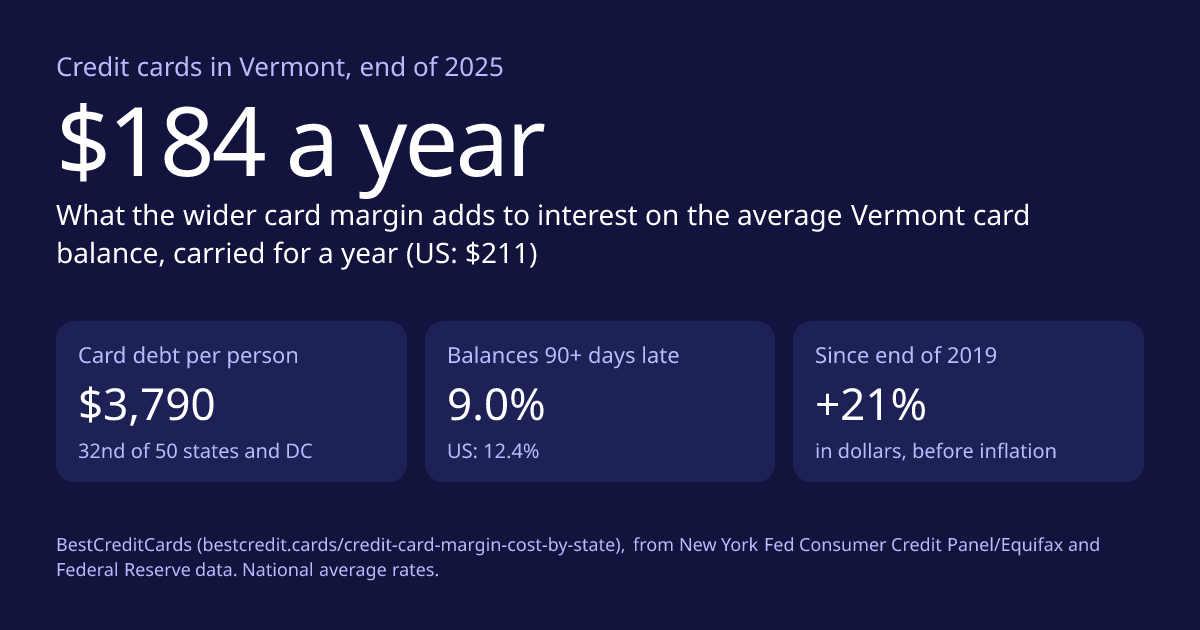
| 32 | Vermont | $3,790 | +21.1% | -3.9% | 9.0% | $845 | $184 |
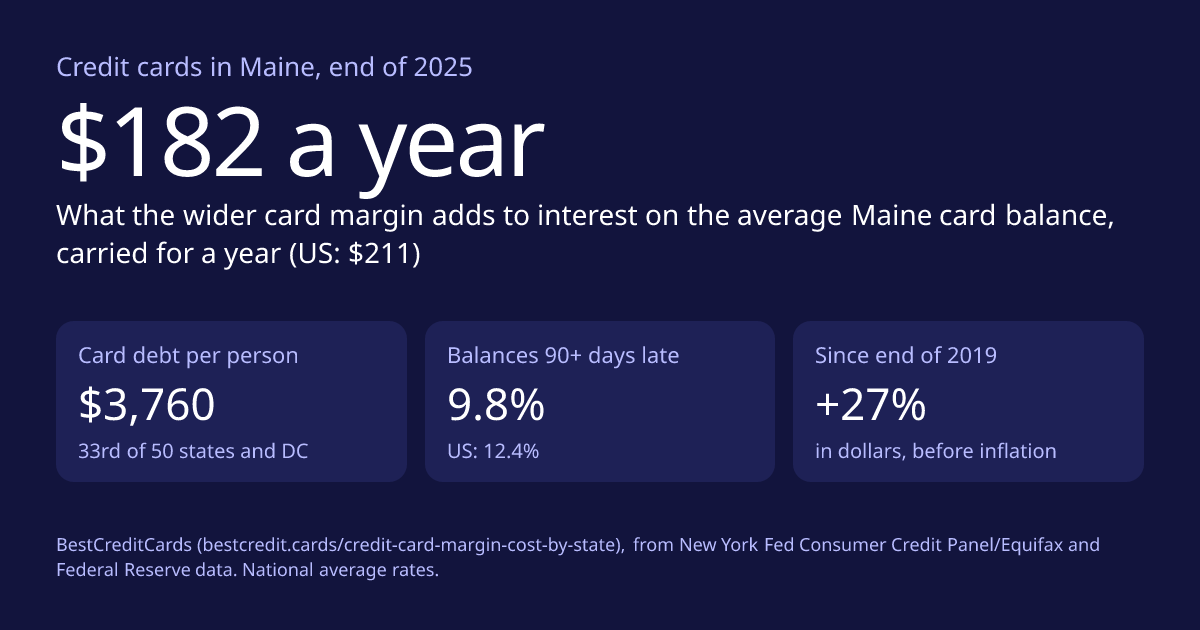
| 33 | Maine | $3,760 | +27.0% | +0.8% | 9.8% | $838 | $182 |
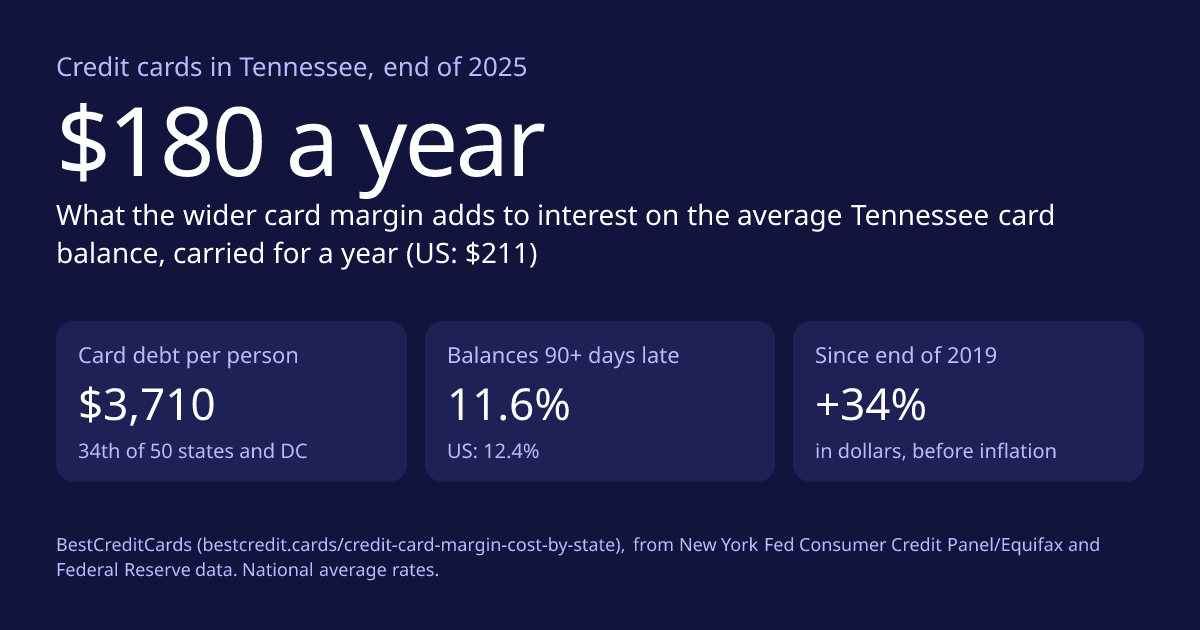
| 34 | Tennessee | $3,710 | +34.4% | +6.6% | 11.6% | $827 | $180 |
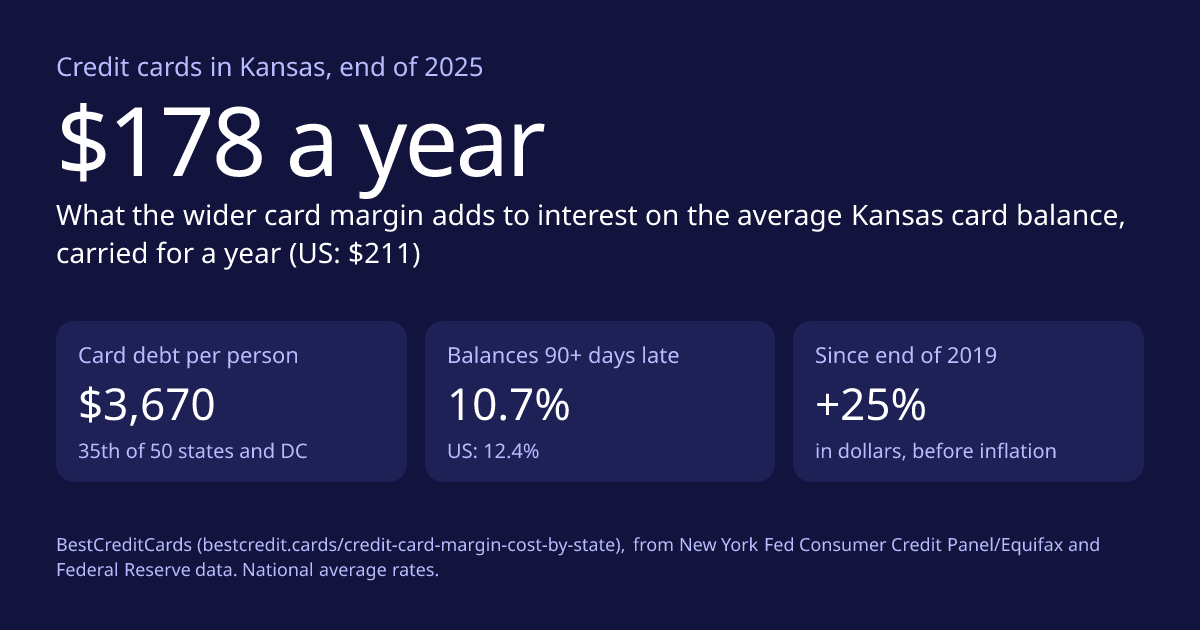
| 35 | Kansas | $3,670 | +25.3% | -0.6% | 10.7% | $818 | $178 |
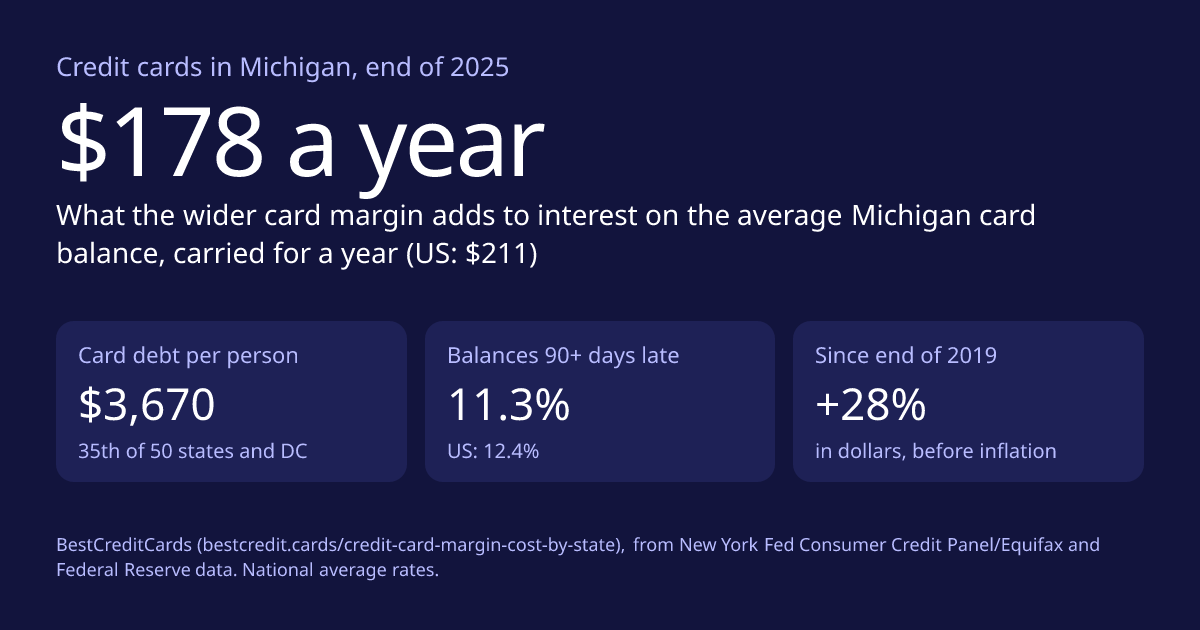
| 35 | Michigan | $3,670 | +28.3% | +1.8% | 11.3% | $818 | $178 |
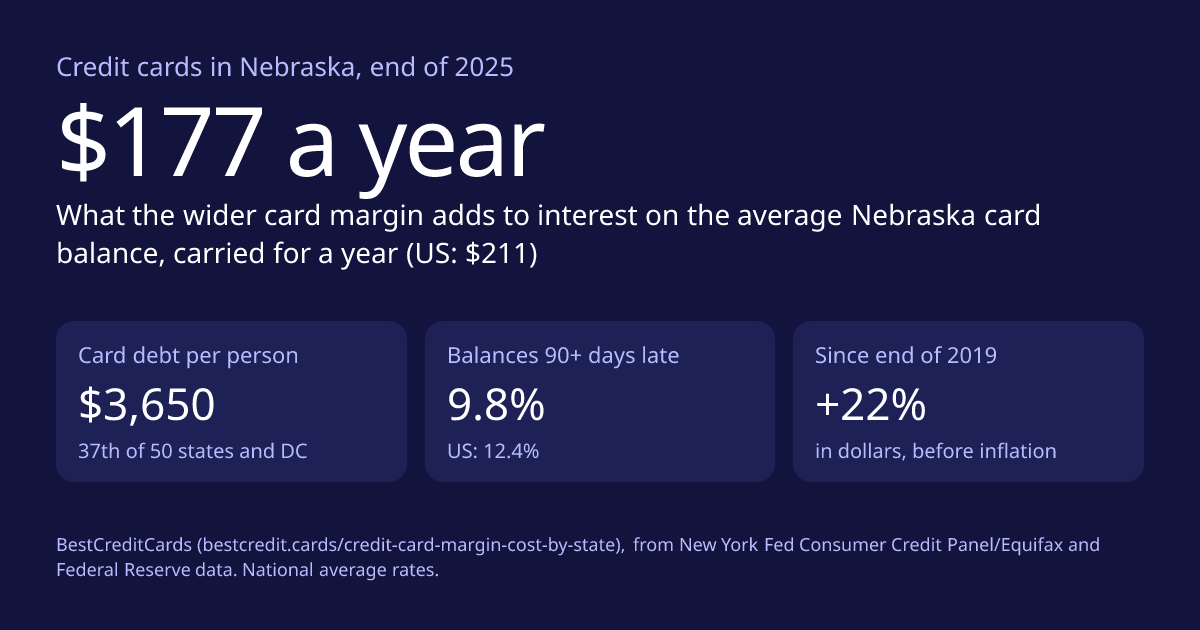
| 37 | Nebraska | $3,650 | +21.7% | -3.5% | 9.8% | $814 | $177 |
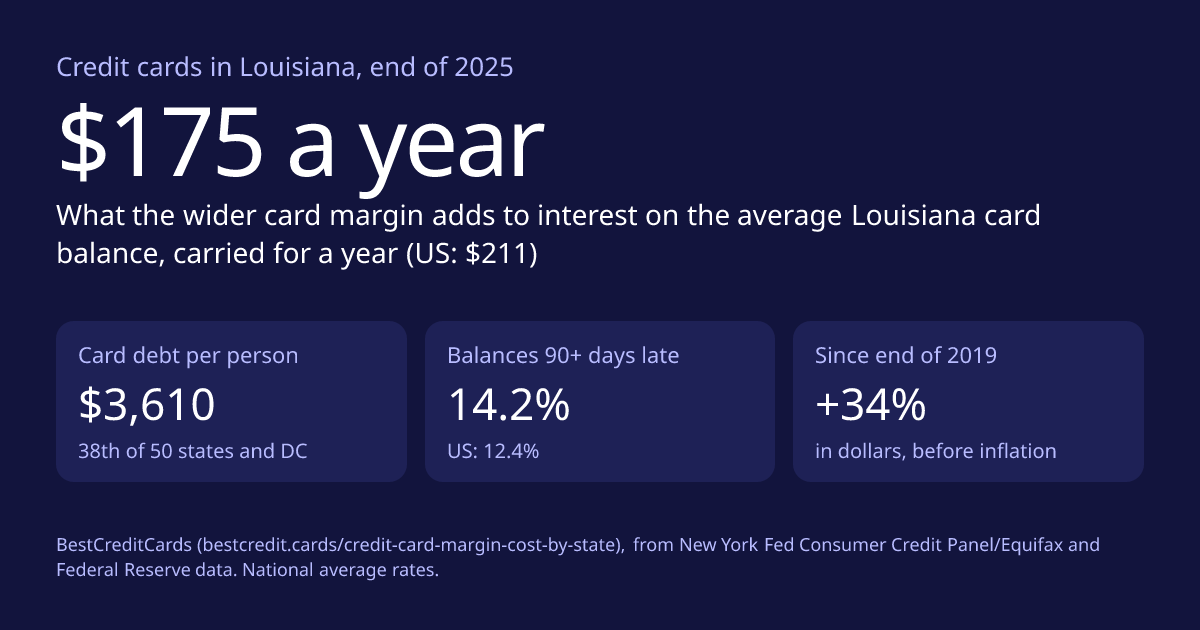
| 38 | Louisiana | $3,610 | +34.2% | +6.5% | 14.2% | $805 | $175 |
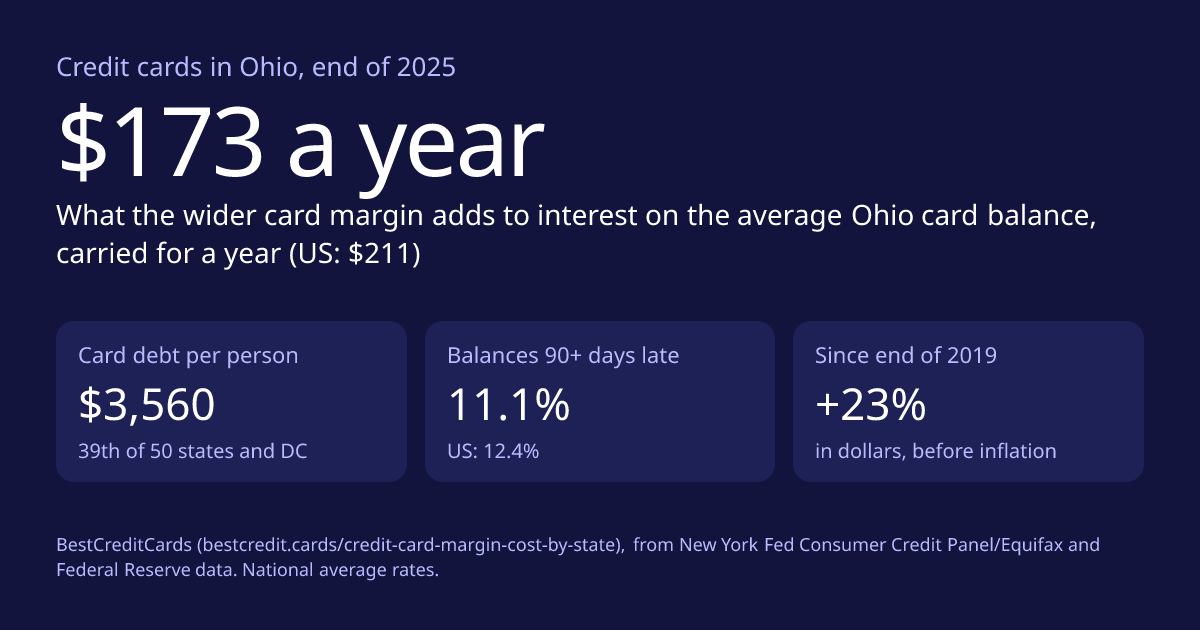
| 39 | Ohio | $3,560 | +23.2% | -2.3% | 11.1% | $794 | $173 |
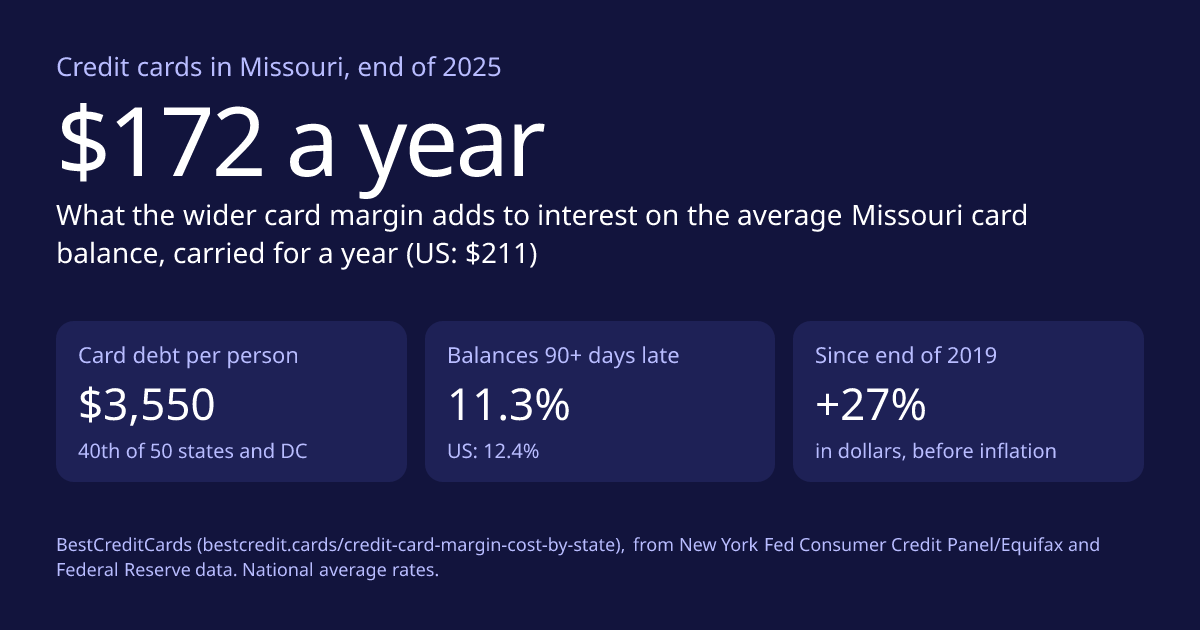
| 40 | Missouri | $3,550 | +26.8% | +0.6% | 11.3% | $792 | $172 |
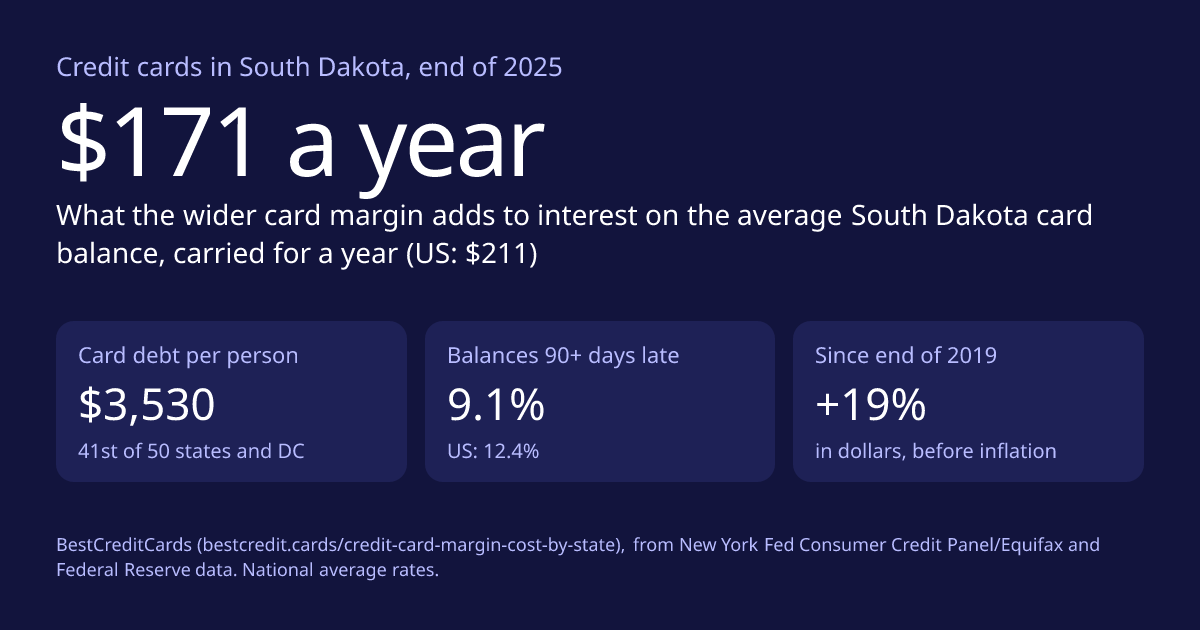
| 41 | South Dakota | $3,530 | +18.9% | -5.7% | 9.1% | $787 | $171 |
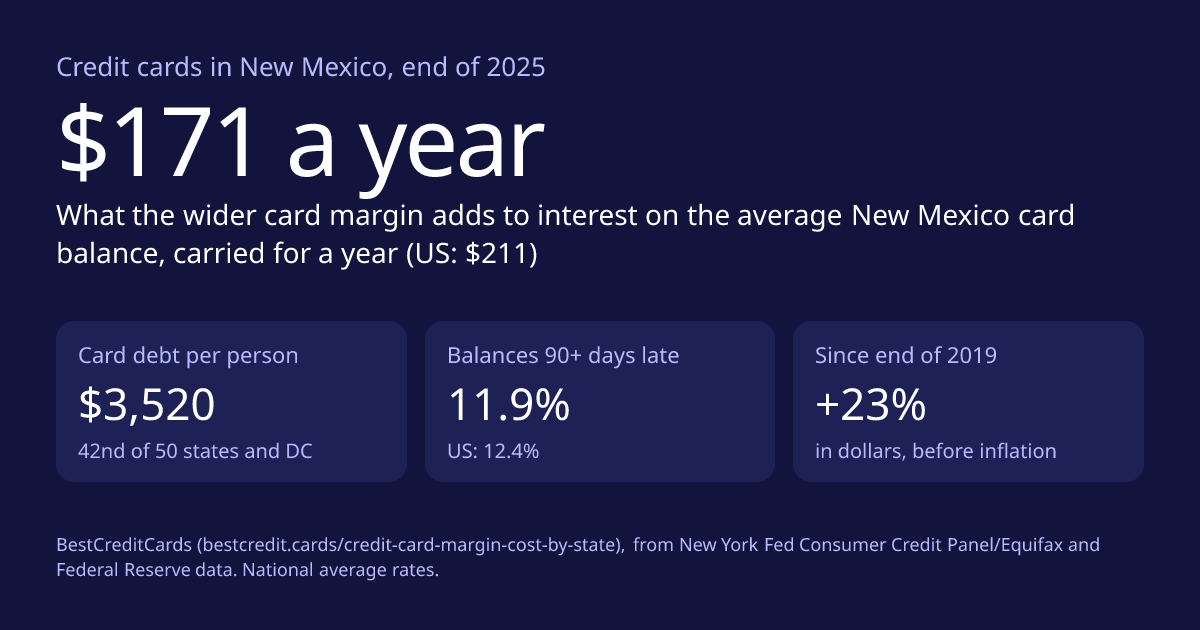
| 42 | New Mexico | $3,520 | +23.1% | -2.4% | 11.9% | $785 | $171 |
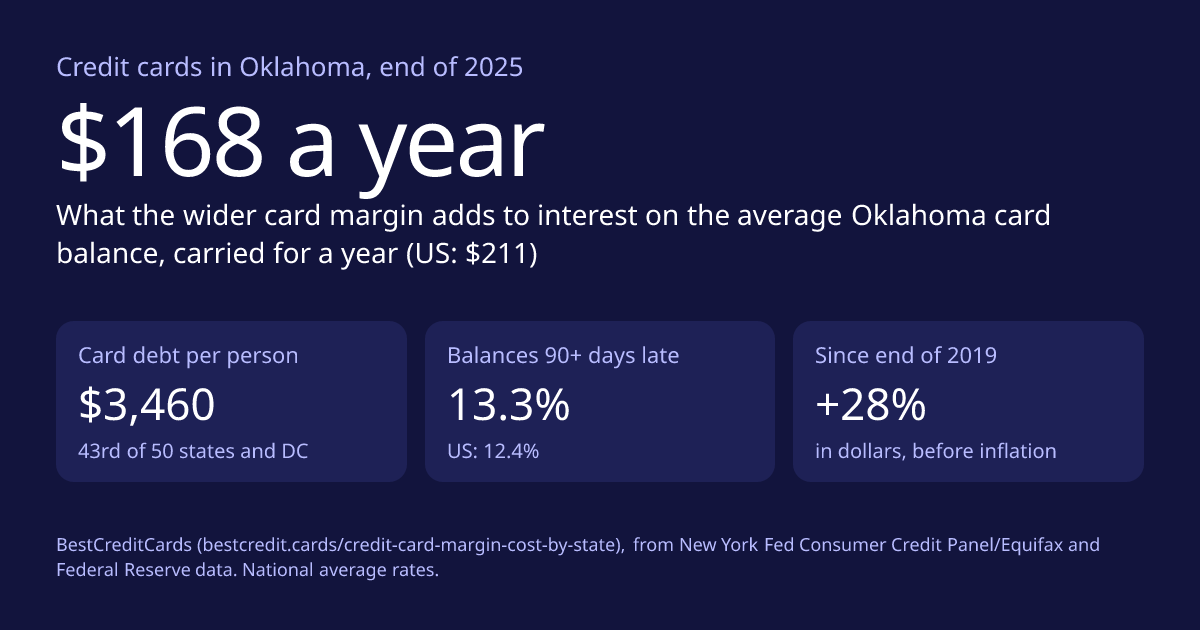
| 43 | Oklahoma | $3,460 | +27.7% | +1.3% | 13.3% | $772 | $168 |
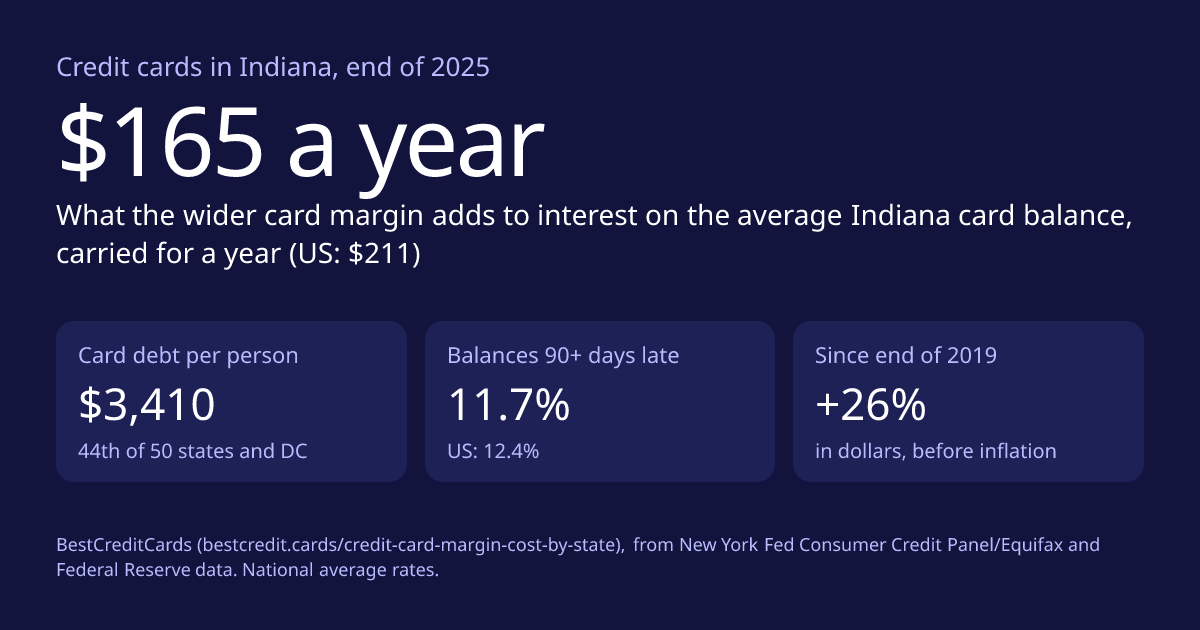
| 44 | Indiana | $3,410 | +26.3% | +0.2% | 11.7% | $760 | $165 |
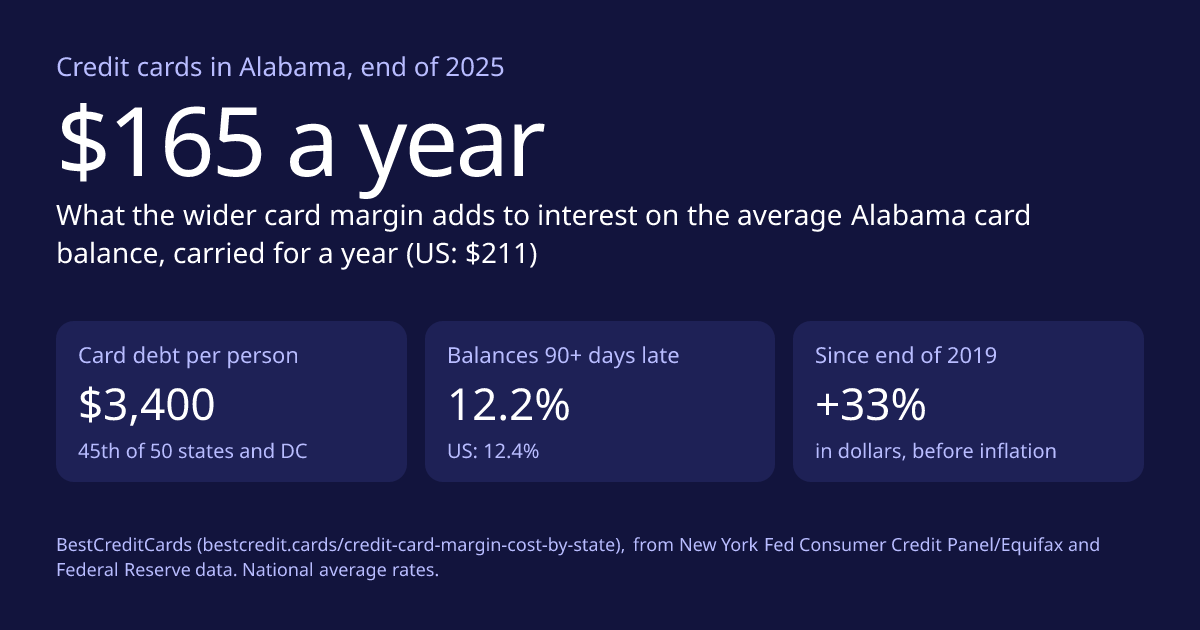
| 45 | Alabama | $3,400 | +33.3% | +5.8% | 12.2% | $758 | $165 |
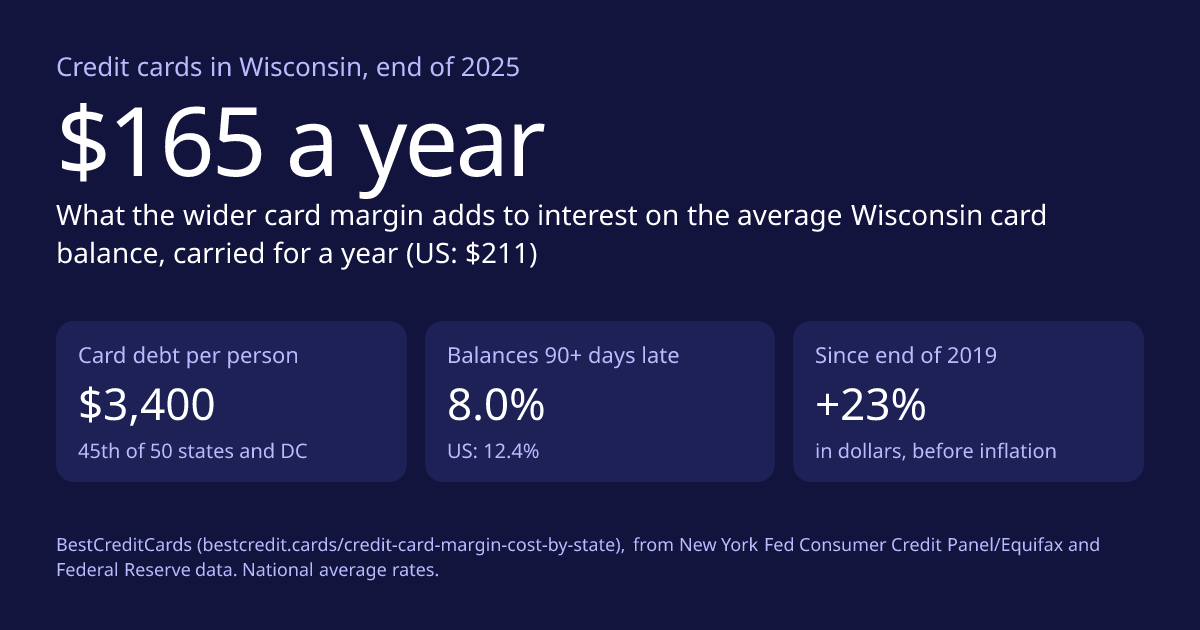
| 45 | Wisconsin | $3,400 | +22.7% | -2.6% | 8.0% | $758 | $165 |
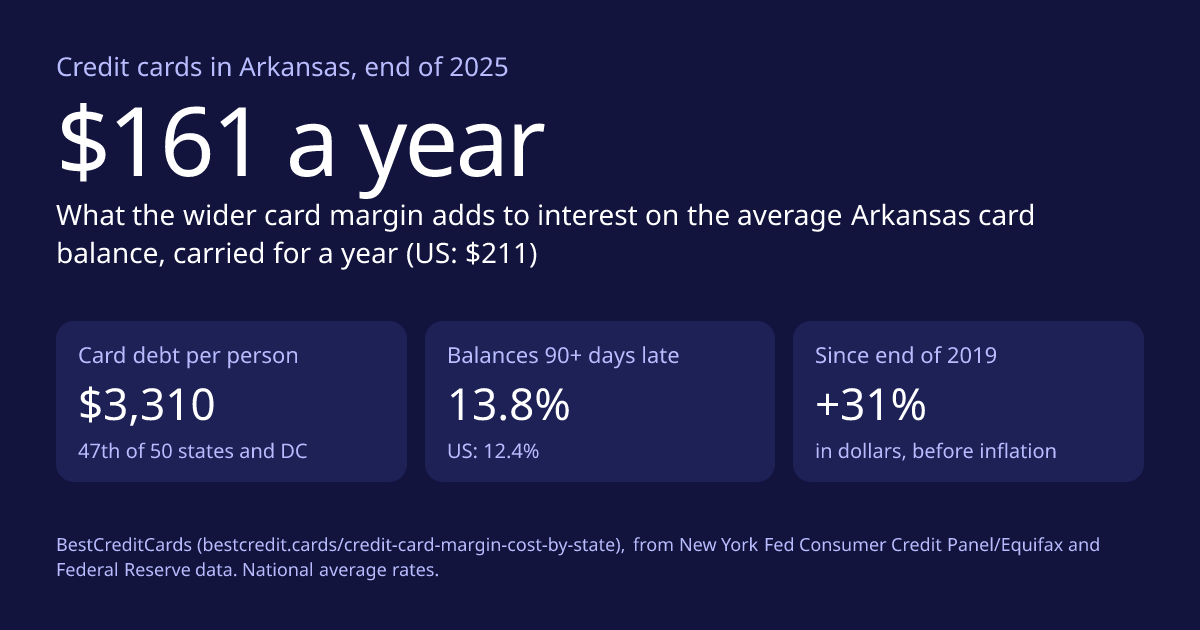
| 47 | Arkansas | $3,310 | +30.8% | +3.8% | 13.8% | $738 | $161 |
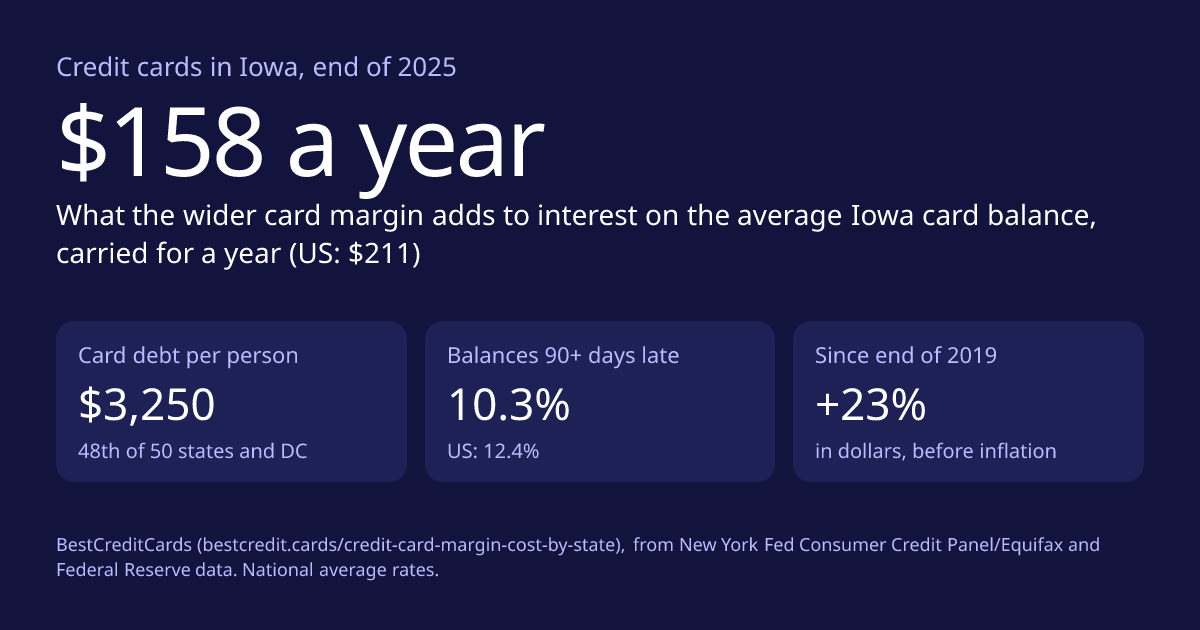
| 48 | Iowa | $3,250 | +22.6% | -2.7% | 10.3% | $725 | $158 |
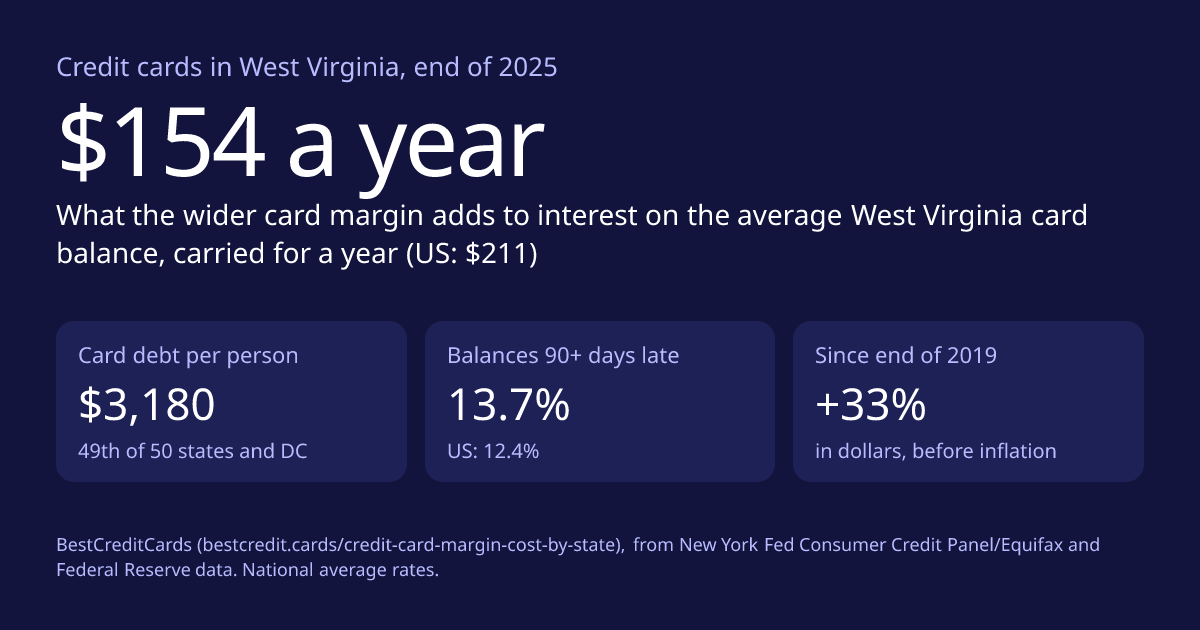
| 49 | West Virginia | $3,180 | +33.1% | +5.5% | 13.7% | $709 | $154 |
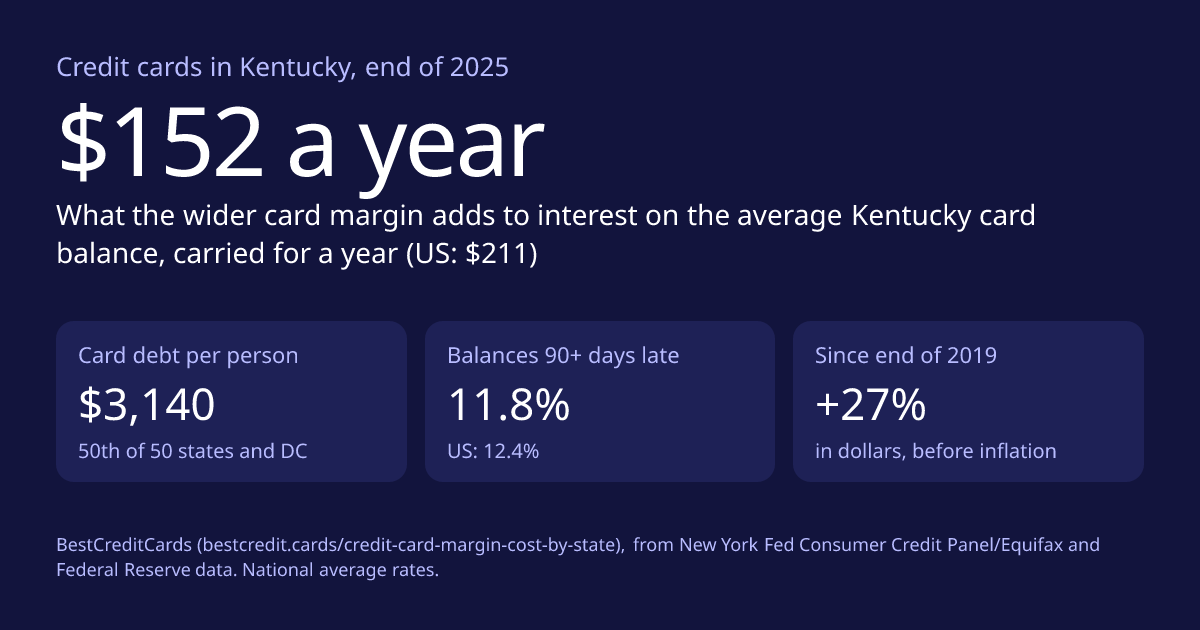
| 50 | Kentucky | $3,140 | +26.6% | +0.4% | 11.8% | $700 | $152 |
| 51 | Mississippi | $3,030 | +35.3% | +7.3% | 13.4% | $676 | $147 |
| United States | $4,350 | +28.3% | +1.8% | 12.4% | $970 | $211 |
How we calculated it
- Card debt per person is the New York Fed’s figure: credit card balances on Equifax credit reports divided by the number of people aged 18 and over with a credit report, in each state, at the end of 2025. It averages over everyone with a credit file, with or without a card. It comes from a 5% sample, so small differences between states are within sampling variation.
- 90+ days late is the New York Fed’s percent of each state’s card balances that were 90 or more days past due.
- After inflation divides each change by the change in the consumer price index for all urban consumers (CPI-U, Bureau of Labor Statistics via FRED) between the Decembers of the two years.
- Interest a year is the balance times the Federal Reserve’s average APR on card accounts charged interest, 22.30% in November 2025: simple interest on a balance carried for the whole year.
- The margin’s widening is the rise in that average APR’s margin over the prime rate, from 10.45 points in November 2015 to 15.30 in November 2025: 4.85 points (our interest margin page). The extra interest is the balance times that widening.
Read these figures as an illustration of scale, not a bill. Three limits matter:
- The rate and the margin are national averages. Card issuers don’t publish rates by state, so the differences between states come only from how much people owe.
- The balances include amounts that are paid in full when the statement arrives and never charged interest. The CFPB estimates that around 50% of card accounts carry a balance from month to month (Consumer Financial Protection Bureau, The Consumer Credit Card Market: Report to Congress, December 2025, checked October 13, 2026). For someone who pays in full, the cost is zero; for someone who carries more, it is higher.
- The balances are for the end of 2025, and the APR and margin are from the Federal Reserve’s last survey before that date, November 2025, so every figure describes the same moment. Rate changes since then aren’t applied to these balances.
Puerto Rico appears in the New York Fed’s file without a population or late-payment figure, so it isn’t ranked. All figures update when the New York Fed publishes its next annual state file (each February), with the rates from the Federal Reserve’s last survey before that file’s date.
Use this data
Download every state as a CSV file. Our calculations are free to use with credit under CC BY 4.0; the Federal Reserve’s own figures are public. Source data: New York Fed, Household Debt and Credit (state file saved October 15, 2026).
An image for each state
Every state has a ready-made 1200 × 630 image with its own figures, free to use with the same credit. Choose one in Your state, or download it directly:
- Alabama
- Alaska
- Arizona
- Arkansas
- California
- Colorado
- Connecticut
- Delaware
- District of Columbia
- Florida
- Georgia
- Hawaii
- Idaho
- Illinois
- Indiana
- Iowa
- Kansas
- Kentucky
- Louisiana
- Maine
- Maryland
- Massachusetts
- Michigan
- Minnesota
- Mississippi
- Missouri
- Montana
- Nebraska
- Nevada
- New Hampshire
- New Jersey
- New Mexico
- New York
- North Carolina
- North Dakota
- Ohio
- Oklahoma
- Oregon
- Pennsylvania
- Rhode Island
- South Carolina
- South Dakota
- Tennessee
- Texas
- Utah
- Vermont
- Virginia
- Washington
- West Virginia
- Wisconsin
- Wyoming
Cite this page
BestCreditCards, “What the wider credit card margin costs in each US state,” updated October 15, 2026, https://bestcredit.cards/credit-card-margin-cost-by-state. Calculated from Federal Reserve Bank of New York and Federal Reserve Board data.Embed the map
<a href="https://bestcredit.cards/credit-card-margin-cost-by-state"><img src="https://bestcredit.cards/credit-card-margin-cost-by-state/map.png" width="1200" height="630" alt="Map of the extra interest the wider credit card margin adds a year in each US state, the end of 2025"></a>
<p>Source: <a href="https://bestcredit.cards/credit-card-margin-cost-by-state">BestCreditCards</a>, from Federal Reserve data.</p>
More: credit card statistics · credit card interest margin · what a 10% rate cap would mean · press and data
Drafted October 15, 2026. Not yet approved for publication by Matt Woodley. Data last changed October 15, 2026. State figures from the New York Fed’s file of February 2026; rates re-downloaded weekly. How we check every figure