Credit card statistics
Americans owed $1.35 trillion in revolving credit, mostly credit cards, in August 2026, up 3.4% on a year earlier. Accounts charged interest had an average 22.36% APR in August 2026, and 2.85% of card balances at banks were 30 or more days late in Q2 2026. Every chart below is drawn from the official source series or our dated card records, with sources and the available history shown.
Key figures
- Revolving credit outstanding
- $1.35 trillionup 3.4% in a yearAugust 2026, Federal Reserve G.19
- Average APR, accounts charged interest
- 22.36%down 0.47 pts in a yearAugust 2026, Federal Reserve G.19
- Card APR above the Fed funds rate
- 18.73 ptsThe widest since the series began, November 1994August 2026, our calculation from G.19 and H.15
- Card balances 30+ days late
- 2.85%down 0.19 pts in a yearQ2 2026, commercial banks
- Card debt per person with a credit report
- $4,350up $960 since Q4 2019Q4 2025, New York Fed
- Card balances charged off
- 3.82%down 0.37 pts in a yearQ2 2026, annualized, commercial banks
- Cards with no annual fee
- 70.2%99 of the 141 US cards in our recordsFrom issuers’ own terms, checked to October 22, 2026
US data, USD. Each figure has its own observation period; an October update does not mean an October measurement. Content updated October 28, 2026.
Download the official time series (CSV) · Compare years · Choose the right statistic · Cite this research
How much credit card debt do Americans have?
US households owed $1.35 trillion in revolving consumer credit in August 2026, according to the Federal Reserve’s G.19 Consumer Credit release. That is up $44.1 billion (3.4%) on August 2025. Credit card loans make up most of revolving credit; it also includes other revolving lines such as prearranged overdraft plans. The highest month on record was July 2026, at $1.36 trillion.
The total includes balances that cardholders will pay in full when their statement arrives, so not all of it is costing interest. The Federal Reserve doesn’t split the total between the two.
Source: Federal Reserve Board, G.19 Consumer Credit, series REVOLSL, via FRED, saved October 13, 2026. Published in millions of dollars; shown in trillions.
Show the data (December of each year and the latest month, 59 rows)
Every month is in the CSV download.
| Period | $ trillion |
|---|---|
| August 2026 | 1.352 |
| December 2025 | 1.324 |
| December 2024 | 1.297 |
| December 2023 | 1.299 |
| December 2022 | 1.193 |
| December 2021 | 1.034 |
| December 2020 | 0.955 |
| December 2019 | 1.092 |
| December 2018 | 1.054 |
| December 2017 | 1.017 |
| December 2016 | 0.960 |
| December 2015 | 0.898 |
| December 2014 | 0.887 |
| December 2013 | 0.854 |
| December 2012 | 0.840 |
| December 2011 | 0.840 |
| December 2010 | 0.839 |
| December 2009 | 0.916 |
| December 2008 | 1.004 |
| December 2007 | 1.002 |
| December 2006 | 0.924 |
| December 2005 | 0.830 |
| December 2004 | 0.800 |
| December 2003 | 0.768 |
| December 2002 | 0.751 |
| December 2001 | 0.715 |
| December 2000 | 0.683 |
| December 1999 | 0.611 |
| December 1998 | 0.581 |
| December 1997 | 0.540 |
| December 1996 | 0.508 |
| December 1995 | 0.444 |
| December 1994 | 0.366 |
| December 1993 | 0.310 |
| December 1992 | 0.278 |
| December 1991 | 0.264 |
| December 1990 | 0.239 |
| December 1989 | 0.211 |
| December 1988 | 0.185 |
| December 1987 | 0.161 |
| December 1986 | 0.141 |
| December 1985 | 0.124 |
| December 1984 | 0.100 |
| December 1983 | 0.079 |
| December 1982 | 0.066 |
| December 1981 | 0.061 |
| December 1980 | 0.055 |
| December 1979 | 0.054 |
| December 1978 | 0.046 |
| December 1977 | 0.037 |
| December 1976 | 0.016 |
| December 1975 | 0.014 |
| December 1974 | 0.013 |
| December 1973 | 0.011 |
| December 1972 | 0.009 |
| December 1971 | 0.008 |
| December 1970 | 0.005 |
| December 1969 | 0.004 |
| December 1968 | 0.002 |
Balances and late payments in reports
- $1.26 trillion
- Total US credit card balances (Q2 2026).Source: Federal Reserve Bank of New York, Quarterly Report on Household Debt and Credit 2026:Q2 (press release, August 2026), checked October 13, 2026. New York Fed Consumer Credit Panel, a nationally representative sample of Equifax credit records..
- $21 billion
- Increase in total US credit card balances from Q1 2026 to Q2 2026.Source: Federal Reserve Bank of New York, Quarterly Report on Household Debt and Credit 2026:Q2 (press release, August 2026), checked October 13, 2026. New York Fed Consumer Credit Panel, a nationally representative sample of Equifax credit records.
- $54 billion
- Increase in total US credit card balances from Q2 2025 to Q2 2026.Source: Federal Reserve Bank of New York, Quarterly Report on Household Debt and Credit 2026:Q2 (press release, August 2026), checked October 13, 2026. Press release table "Household Debt and Credit Developments as of Q2 2026", row Credit Card Debt; columns: quarterly change, annual change (billions), total (trillions).
- 6.97%
- Credit card balances newly becoming 90+ days delinquent (annualized share of balances) (Q2 2026).Source: Federal Reserve Bank of New York, Quarterly Report on Household Debt and Credit 2026:Q2 (press release, August 2026), checked October 13, 2026. New York Fed press release table "Flow into Serious Delinquency"; columns Q2 2025 (6.93%) and Q2 2026 (6.97%). It measures balances, not people.
- $5,300
- Average monthly credit card balance per cardholder (2024).Source: Consumer Financial Protection Bureau, The Consumer Credit Card Market: Report to Congress, December 2025, checked October 13, 2026. CFPB analysis of credit bureau records and account data from large bank issuers, as of 2024. The CFPB gives it as "about $5,300"; for cardholders with prime credit scores, about $8,700.
- 3%
- Delinquency rate on general purpose credit cards at year-end (Year-end 2024).Source: Consumer Financial Protection Bureau, The Consumer Credit Card Market: Report to Congress, December 2025, checked October 13, 2026. CFPB analysis of credit bureau records and account data from large bank issuers, as of 2024. Private label cards: 3.8 percent.
- $2,500
- Median unpaid credit card balance among consumers who carry a balance (2025).Source: Federal Reserve Bank of Atlanta, 2025 Survey and Diary of Consumer Payment Choice: Summary Results (No. 26-1, May 2026), checked October 13, 2026. Atlanta Fed survey and payment diary of US consumers, October 2025. Self-reported. The mean was $6,067.
- $6,067
- Mean unpaid credit card balance among consumers who carry a balance (2025).Source: Federal Reserve Bank of Atlanta, 2025 Survey and Diary of Consumer Payment Choice: Summary Results (No. 26-1, May 2026), checked October 13, 2026. Atlanta Fed survey and payment diary of US consumers, October 2025. Self-reported. The median was $2,500.
Source: Atlanta Fed survey and payment diary, 2025, checked October 13, 2026. Self-reported balances among consumers who carry a balance; these are not averages across all adults.
| Measure | Balance |
|---|---|
| Median unpaid credit card balance among consumers who carry a balance | $2,500 |
| Mean unpaid credit card balance among consumers who carry a balance | $6,067 |
The mean and median describe the same survey population. Higher balances can pull the mean above the middle person’s balance. Keep that distinction when quoting a “typical” debt figure.
What is the average credit card debt per person, by state?
Americans with a credit report owed an average of $4,350 each on credit cards at the end of 2025, according to the New York Fed’s state-level household debt statistics. That is up $960 on $3,390 at the end of 2019. Nationally, 12.36% of card balances on credit reports were 90 or more days late. That share comes from credit reports, not banks’ books, so it is not comparable with the bank delinquency rate under late payments.
Card debt per person was highest in the District of Columbia ($5,500), Alaska ($5,250), Hawaii ($5,220), New Jersey ($5,160), and Maryland ($5,090), and lowest in Mississippi ($3,030), Kentucky ($3,140), and West Virginia ($3,180). The share of card balances 90 or more days late was highest in Nevada (16.28%) and lowest in Wisconsin (8.03%).
This average divides all card balances on credit reports by everyone aged 18 or over with a credit report, with or without a card, and it includes balances that will be paid in full. It is not the balance a typical cardholder carries from month to month: for that, see the survey figures for people who revolve, under how much credit card debt Americans have. What these balances cost each state at today’s card rates is on our state-by-state credit card cost page.
- under $3,530
- $3,530 to under $3,850
- $3,850 to under $4,260
- $4,260 to under $4,820
- $4,820 or more
Source: New York Fed, State Level Household Debt Statistics, Q4 2025. Shades split the states into five groups of about ten.
Show every state (51 rows)
| Rank | State | Debt per person | Balances 90+ days late |
|---|---|---|---|
| 1 | District of Columbia | $5,500 | 11.16% |
| 2 | Alaska | $5,250 | 9.79% |
| 3 | Hawaii | $5,220 | 10.17% |
| 4 | New Jersey | $5,160 | 11.41% |
| 5 | Maryland | $5,090 | 11.65% |
| 6 | Nevada | $5,060 | 16.28% |
| 7 | Florida | $5,050 | 14.94% |
| 8 | California | $5,000 | 13.20% |
| 9 | Connecticut | $4,960 | 10.53% |
| 10 | Colorado | $4,910 | 11.06% |
| 11 | New York | $4,820 | 12.91% |
| 12 | Virginia | $4,770 | 9.85% |
| 13 | Massachusetts | $4,650 | 10.33% |
| 14 | Washington | $4,640 | 9.34% |
| 15 | Texas | $4,620 | 14.19% |
| 16 | Georgia | $4,610 | 13.91% |
| 17 | Arizona | $4,530 | 13.67% |
| 18 | Delaware | $4,520 | 12.22% |
| 19 | New Hampshire | $4,500 | 9.84% |
| 20 | Rhode Island | $4,490 | 11.38% |
| 21 | Illinois | $4,260 | 11.59% |
| 21 | Utah | $4,260 | 9.45% |
| 23 | North Carolina | $4,160 | 12.50% |
| 24 | South Carolina | $4,090 | 13.36% |
| 25 | Oregon | $4,030 | 9.49% |
| 26 | Minnesota | $3,990 | 8.55% |
| 26 | Wyoming | $3,990 | 10.54% |
| 28 | North Dakota | $3,970 | 9.02% |
| 29 | Pennsylvania | $3,950 | 12.34% |
| 30 | Idaho | $3,870 | 9.52% |
| 31 | Montana | $3,850 | 9.78% |
| 32 | Vermont | $3,790 | 8.99% |
| 33 | Maine | $3,760 | 9.83% |
| 34 | Tennessee | $3,710 | 11.59% |
| 35 | Kansas | $3,670 | 10.74% |
| 35 | Michigan | $3,670 | 11.28% |
| 37 | Nebraska | $3,650 | 9.75% |
| 38 | Louisiana | $3,610 | 14.24% |
| 39 | Ohio | $3,560 | 11.14% |
| 40 | Missouri | $3,550 | 11.35% |
| 41 | South Dakota | $3,530 | 9.14% |
| 42 | New Mexico | $3,520 | 11.90% |
| 43 | Oklahoma | $3,460 | 13.28% |
| 44 | Indiana | $3,410 | 11.72% |
| 45 | Alabama | $3,400 | 12.22% |
| 45 | Wisconsin | $3,400 | 8.03% |
| 47 | Arkansas | $3,310 | 13.84% |
| 48 | Iowa | $3,250 | 10.26% |
| 49 | West Virginia | $3,180 | 13.72% |
| 50 | Kentucky | $3,140 | 11.84% |
| 51 | Mississippi | $3,030 | 13.36% |
| United States | $4,350 | 12.36% |
Source: New York Fed, State Level Household Debt Statistics (data file), Q4 2025, saved October 15, 2026. Debt per capita is the card balance on Equifax credit reports divided by consumers aged 18+ with a credit report. Download every state (CSV).
US credit card statistics by year
Compare completed years using the same definitions throughout. Balances are December observations, APRs are November surveys, and bank delinquency and charge-offs are fourth-quarter observations. These are year-end snapshots, not annual averages.
| Year | Revolving credit (December) | Interest-bearing APR (November) | 30+ days late (Q4) | Net charge-offs (Q4, annualized) |
|---|---|---|---|---|
| 2025 | $1.32 trillion | 22.30% | 2.95% | 4.09% |
| 2024 | $1.30 trillion | 22.80% | 3.08% | 4.57% |
| 2023 | $1.30 trillion | 22.75% | 3.10% | 4.18% |
| 2022 | $1.19 trillion | 20.40% | 2.26% | 2.51% |
| 2021 | $1.03 trillion | 16.44% | 1.57% | 1.63% |
| 2020 | $0.95 trillion | 16.28% | 2.10% | 2.68% |
| 2019 | $1.09 trillion | 16.88% | 2.61% | 3.78% |
| 2018 | $1.05 trillion | 16.86% | 2.54% | 3.67% |
| 2017 | $1.02 trillion | 14.99% | 2.48% | 3.70% |
| 2016 | $0.96 trillion | 13.61% | 2.37% | 3.49% |
| 2015 | $0.90 trillion | 13.70% | 2.16% | 2.94% |
| 2014 | $0.89 trillion | 13.68% | 2.15% | 3.01% |
| 2013 | $0.85 trillion | 12.89% | 2.38% | 3.37% |
| 2012 | $0.84 trillion | 12.81% | 2.71% | 3.84% |
| 2011 | $0.84 trillion | 12.78% | 3.25% | 4.63% |
| 2010 | $0.84 trillion | 13.67% | 4.14% | 7.91% |
| 2009 | $0.92 trillion | 14.37% | 6.33% | 10.54% |
| 2008 | $1.00 trillion | 13.36% | 5.64% | 6.53% |
| 2007 | $1.00 trillion | 14.38% | 4.60% | 4.32% |
| 2006 | $0.92 trillion | 15.09% | 3.95% | 3.70% |
| 2005 | $0.83 trillion | 14.49% | 3.54% | 6.09% |
| 2004 | $0.80 trillion | 13.92% | 4.03% | 4.68% |
| 2003 | $0.77 trillion | 12.93% | 4.43% | 6.01% |
| 2002 | $0.75 trillion | 12.78% | 4.84% | 5.54% |
| 2001 | $0.71 trillion | 13.90% | 4.69% | 6.35% |
| 2000 | $0.68 trillion | 15.26% | 4.57% | 4.39% |
| 1999 | $0.61 trillion | 14.78% | 4.55% | 4.49% |
| 1998 | $0.58 trillion | 15.73% | 4.74% | 5.08% |
| 1997 | $0.54 trillion | 15.74% | 4.81% | 5.40% |
| 1996 | $0.51 trillion | 15.52% | 4.60% | 4.65% |
| 1995 | $0.44 trillion | 15.74% | 3.95% | 3.93% |
| 1994 | $0.37 trillion | 15.77% | 3.29% | 3.08% |
Source: Federal Reserve Board, G.19 Consumer Credit, series REVOLSL; Federal Reserve Board, G.19 Consumer Credit, series TERMCBCCINTNS; Federal Reserve Board, Charge-Off and Delinquency Rates on Loans and Leases at Commercial Banks, series DRCCLACBS; Federal Reserve Board, Charge-Off and Delinquency Rates on Loans and Leases at Commercial Banks, series CORCCACBS, via FRED, saved October 13, 2026. Our selection of the final observation in each complete year. Missing year-end observations are omitted. The current partial year remains in the headline figures above.
Use the full chart tables or CSV for more precision. Historical observations can be revised by their publishers: this is the history in the saved source release, not a reconstruction of what was first reported at the time.
Are revolving balances at a record after inflation?
A dollar total can rise because prices rise, because more people borrow, or because borrowing per person changes. Adjusting for inflation addresses only the first of those effects.
In August 2026, revolving credit was $1.35 trillion. The highest inflation-adjusted balance in the saved history was $1.59 trillion in February 2008, expressed in August 2026 dollars. This is an aggregate balance, not a measure of household affordability.
- Reported dollars
- August 2026 dollars
Source: Federal Reserve Board, G.19 Consumer Credit, series REVOLSL; U.S. Bureau of Labor Statistics, Consumer Price Index, series CPIAUCSL, via FRED, saved October 15, 2026. Our calculation: balance in each month × CPI in the base month ÷ CPI in that month. Both inputs are seasonally adjusted. Only shared months are used; there is no interpolation.
Show the data (December of each year and the latest month, 59 rows)
Every month’s reported balance and the CPI are in the CSV download; the adjusted value is the reported balance × CPI in August 2026 ÷ CPI in that month.
| Period | Reported $ trillion | August 2026 $ trillion |
|---|---|---|
| August 2026 | 1.352 | 1.352 |
| December 2025 | 1.324 | 1.357 |
| December 2024 | 1.297 | 1.364 |
| December 2023 | 1.299 | 1.406 |
| December 2022 | 1.193 | 1.334 |
| December 2021 | 1.034 | 1.230 |
| December 2020 | 0.955 | 1.217 |
| December 2019 | 1.092 | 1.411 |
| December 2018 | 1.054 | 1.393 |
| December 2017 | 1.017 | 1.371 |
| December 2016 | 0.960 | 1.322 |
| December 2015 | 0.898 | 1.262 |
| December 2014 | 0.887 | 1.255 |
| December 2013 | 0.854 | 1.216 |
| December 2012 | 0.840 | 1.214 |
| December 2011 | 0.840 | 1.235 |
| December 2010 | 0.839 | 1.272 |
| December 2009 | 0.916 | 1.408 |
| December 2008 | 1.004 | 1.587 |
| December 2007 | 1.002 | 1.583 |
| December 2006 | 0.924 | 1.520 |
| December 2005 | 0.830 | 1.399 |
| December 2004 | 0.800 | 1.394 |
| December 2003 | 0.768 | 1.384 |
| December 2002 | 0.751 | 1.380 |
| December 2001 | 0.715 | 1.346 |
| December 2000 | 0.683 | 1.306 |
| December 1999 | 0.611 | 1.209 |
| December 1998 | 0.581 | 1.182 |
| December 1997 | 0.540 | 1.115 |
| December 1996 | 0.508 | 1.066 |
| December 1995 | 0.444 | 0.964 |
| December 1994 | 0.366 | 0.814 |
| December 1993 | 0.310 | 0.708 |
| December 1992 | 0.278 | 0.654 |
| December 1991 | 0.264 | 0.638 |
| December 1990 | 0.239 | 0.594 |
| December 1989 | 0.211 | 0.559 |
| December 1988 | 0.185 | 0.511 |
| December 1987 | 0.161 | 0.465 |
| December 1986 | 0.141 | 0.425 |
| December 1985 | 0.124 | 0.380 |
| December 1984 | 0.100 | 0.318 |
| December 1983 | 0.079 | 0.260 |
| December 1982 | 0.066 | 0.227 |
| December 1981 | 0.061 | 0.216 |
| December 1980 | 0.055 | 0.213 |
| December 1979 | 0.054 | 0.233 |
| December 1978 | 0.046 | 0.225 |
| December 1977 | 0.037 | 0.201 |
| December 1976 | 0.016 | 0.094 |
| December 1975 | 0.014 | 0.087 |
| December 1974 | 0.013 | 0.085 |
| December 1973 | 0.011 | 0.082 |
| December 1972 | 0.009 | 0.074 |
| December 1971 | 0.008 | 0.067 |
| December 1970 | 0.005 | 0.042 |
| December 1969 | 0.004 | 0.032 |
| December 1968 | 0.002 | 0.019 |
What is the average credit card interest rate?
The average credit card APR on accounts charged interest was 22.36% in August 2026, from the Federal Reserve’s survey of commercial banks, down 0.47 percentage points on August 2025. The average stated APR across all card accounts, whether or not they carry a balance, was 21.19% in August 2026: these are different populations and measures, so neither is the rate a particular applicant will be offered. The highest rate on accounts charged interest since the series began was 23.37%, in August 2024.
These are averages across banks’ existing accounts. A new applicant’s rate depends on their credit: among the 137 US cards in our records, the median top of the published purchase APR range is 28.49% (see card terms). Cardnivo credit card finder matches cards to your credit, with no credit check.
- Card APR, accounts charged interest
- Federal funds rate
Source: Federal Reserve Board, G.19 Consumer Credit, series TERMCBCCINTNS; Federal Reserve Board, H.15 Selected Interest Rates, series FEDFUNDS, via FRED, saved October 13, 2026. The Fed reports card rates quarterly, for February, May, August and November.
Show the data (128 rows)
| Period | Card APR, charged interest | Card APR, all accounts | Federal funds rate |
|---|---|---|---|
| August 2026 | 22.36 | 21.19 | 3.63 |
| May 2026 | 22.15 | 20.94 | 3.63 |
| February 2026 | 21.52 | 21.00 | 3.64 |
| November 2025 | 22.30 | 20.97 | 3.88 |
| August 2025 | 22.83 | 21.39 | 4.33 |
| May 2025 | 22.25 | 21.16 | 4.33 |
| February 2025 | 21.91 | 21.37 | 4.33 |
| November 2024 | 22.80 | 21.47 | 4.64 |
| August 2024 | 23.37 | 21.76 | 5.33 |
| May 2024 | 22.78 | 21.51 | 5.33 |
| February 2024 | 22.63 | 21.59 | 5.33 |
| November 2023 | 22.75 | 21.47 | 5.33 |
| August 2023 | 22.77 | 21.19 | 5.33 |
| May 2023 | 22.16 | 20.84 | 5.06 |
| February 2023 | 20.92 | 20.09 | 4.57 |
| November 2022 | 20.40 | 19.07 | 3.78 |
| August 2022 | 18.43 | 16.27 | 2.33 |
| May 2022 | 16.65 | 15.13 | 0.77 |
| February 2022 | 16.17 | 14.56 | 0.08 |
| November 2021 | 16.44 | 14.51 | 0.08 |
| August 2021 | 17.13 | 14.54 | 0.09 |
| May 2021 | 16.30 | 14.61 | 0.06 |
| February 2021 | 15.91 | 14.75 | 0.08 |
| November 2020 | 16.28 | 14.65 | 0.09 |
| August 2020 | 16.43 | 14.58 | 0.10 |
| May 2020 | 15.78 | 14.52 | 0.05 |
| February 2020 | 16.61 | 15.09 | 1.58 |
| November 2019 | 16.88 | 14.87 | 1.55 |
| August 2019 | 16.97 | 15.10 | 2.13 |
| May 2019 | 17.14 | 15.13 | 2.39 |
| February 2019 | 16.91 | 15.09 | 2.40 |
| November 2018 | 16.86 | 14.73 | 2.20 |
| August 2018 | 16.46 | 14.38 | 1.91 |
| May 2018 | 15.54 | 14.14 | 1.70 |
| February 2018 | 15.32 | 13.63 | 1.42 |
| November 2017 | 14.99 | 13.16 | 1.16 |
| August 2017 | 14.89 | 13.08 | 1.16 |
| May 2017 | 14.00 | 12.77 | 0.91 |
| February 2017 | 13.86 | 12.54 | 0.66 |
| November 2016 | 13.61 | 12.41 | 0.41 |
| August 2016 | 13.76 | 12.51 | 0.40 |
| May 2016 | 13.35 | 12.16 | 0.37 |
| February 2016 | 13.51 | 12.31 | 0.38 |
| November 2015 | 13.70 | 12.22 | 0.12 |
| August 2015 | 13.93 | 12.10 | 0.14 |
| May 2015 | 13.49 | 12.04 | 0.12 |
| February 2015 | 13.53 | 11.98 | 0.11 |
| November 2014 | 13.68 | 11.99 | 0.09 |
| August 2014 | 13.18 | 11.82 | 0.09 |
| May 2014 | 12.74 | 11.83 | 0.09 |
| February 2014 | 13.14 | 11.83 | 0.07 |
| November 2013 | 12.89 | 11.85 | 0.08 |
| August 2013 | 13.11 | 11.88 | 0.08 |
| May 2013 | 12.76 | 11.95 | 0.11 |
| February 2013 | 13.02 | 11.94 | 0.15 |
| November 2012 | 12.81 | 11.88 | 0.16 |
| August 2012 | 13.21 | 11.95 | 0.13 |
| May 2012 | 12.76 | 12.06 | 0.16 |
| February 2012 | 13.04 | 12.34 | 0.10 |
| November 2011 | 12.78 | 12.36 | 0.08 |
| August 2011 | 13.08 | 12.28 | 0.10 |
| May 2011 | 13.06 | 12.89 | 0.09 |
| February 2011 | 13.44 | 13.44 | 0.16 |
| November 2010 | 13.67 | 13.44 | 0.19 |
| August 2010 | 14.22 | 13.59 | 0.19 |
| May 2010 | 14.48 | 13.84 | 0.20 |
| February 2010 | 14.67 | 14.26 | 0.13 |
| November 2009 | 14.37 | 13.60 | 0.12 |
| August 2009 | 14.90 | 13.71 | 0.16 |
| May 2009 | 14.43 | 13.32 | 0.18 |
| February 2009 | 13.54 | 12.97 | 0.22 |
| November 2008 | 13.36 | 12.03 | 0.39 |
| August 2008 | 13.64 | 11.94 | 2.00 |
| May 2008 | 13.51 | 11.88 | 1.98 |
| February 2008 | 13.77 | 12.47 | 2.98 |
| November 2007 | 14.38 | 12.75 | 4.49 |
| August 2007 | 15.24 | 13.59 | 5.02 |
| May 2007 | 14.47 | 13.46 | 5.25 |
| February 2007 | 14.64 | 13.41 | 5.26 |
| November 2006 | 15.09 | 13.31 | 5.25 |
| August 2006 | 14.67 | 13.06 | 5.25 |
| May 2006 | 14.77 | 13.16 | 4.94 |
| February 2006 | 14.38 | 13.30 | 4.49 |
| November 2005 | 14.49 | 12.58 | 4.00 |
| August 2005 | 14.75 | 12.48 | 3.50 |
| May 2005 | 14.81 | 12.77 | 3.00 |
| February 2005 | 14.13 | 12.21 | 2.50 |
| November 2004 | 13.92 | 12.51 | 1.93 |
| August 2004 | 13.60 | 13.02 | 1.43 |
| May 2004 | 12.93 | 12.69 | 1.00 |
| February 2004 | 12.42 | 12.67 | 1.01 |
| November 2003 | 12.93 | 12.35 | 1.00 |
| August 2003 | 13.13 | 12.47 | 1.03 |
| May 2003 | 12.89 | 12.12 | 1.26 |
| February 2003 | 11.96 | 12.26 | 1.26 |
| November 2002 | 12.78 | 13.11 | 1.34 |
| August 2002 | 13.29 | 13.36 | 1.74 |
| May 2002 | 13.36 | 13.53 | 1.75 |
| February 2002 | 13.00 | 13.62 | 1.74 |
| November 2001 | 13.90 | 14.21 | 2.09 |
| August 2001 | 14.67 | 14.59 | 3.65 |
| May 2001 | 14.65 | 15.06 | 4.21 |
| February 2001 | 14.63 | 15.63 | 5.49 |
| November 2000 | 15.26 | 15.99 | 6.51 |
| August 2000 | 15.37 | 15.98 | 6.50 |
| May 2000 | 14.76 | 15.60 | 6.27 |
| February 2000 | 14.30 | 15.55 | 5.73 |
| November 1999 | 14.78 | 15.12 | 5.42 |
| August 1999 | 14.80 | 15.07 | 5.07 |
| May 1999 | 14.94 | 15.19 | 4.74 |
| February 1999 | 14.73 | 15.39 | 4.76 |
| November 1998 | 15.73 | 15.67 | 4.83 |
| August 1998 | 15.84 | 15.82 | 5.55 |
| May 1998 | 15.70 | 15.65 | 5.49 |
| February 1998 | 15.34 | 15.68 | 5.51 |
| November 1997 | 15.74 | 15.76 | 5.52 |
| August 1997 | 15.79 | 15.80 | 5.54 |
| May 1997 | 15.72 | 15.74 | 5.50 |
| February 1997 | 15.15 | 15.88 | 5.19 |
| November 1996 | 15.52 | 15.62 | 5.31 |
| August 1996 | 15.66 | 15.66 | 5.22 |
| May 1996 | 15.33 | 15.44 | 5.24 |
| February 1996 | 15.42 | 15.80 | 5.22 |
| November 1995 | 15.74 | 15.81 | 5.80 |
| August 1995 | 15.90 | 15.92 | 5.74 |
| May 1995 | 16.26 | 16.14 | 6.01 |
| February 1995 | 15.28 | 16.10 | 5.92 |
| November 1994 | 15.77 | 15.69 | 5.29 |
For the interest-bearing rate, the Fed takes each reporting bank’s finance charges billed, divided by the balances of its accounts charged interest, times 12, and averages the banks weighted by those balances. Its all-accounts figure is the average purchase APR across all card accounts, weighted by the number of accounts, whether or not they carry a balance. See G.19, interest-rate definitions. Neither series measures only new offers.
Interest and fees in the CFPB’s and Atlanta Fed’s reports
The CFPB’s averages come from the largest issuers’ data and describe a different set of accounts from the Federal Reserve’s bank survey, so the two don’t match exactly.
- 25.2%
- Average APR on general purpose credit cards (2024).Source: Consumer Financial Protection Bureau, The Consumer Credit Card Market: Report to Congress, December 2025, checked October 13, 2026. CFPB analysis of credit bureau records and account data from large bank issuers, as of 2024. The highest level since at least 2015.
- 31.3%
- Average APR on private label (store) credit cards (2024).Source: Consumer Financial Protection Bureau, The Consumer Credit Card Market: Report to Congress, December 2025, checked October 13, 2026. CFPB analysis of credit bureau records and account data from large bank issuers, as of 2024.
- 27.5%
- Average APR on new general purpose accounts opened in the year (2024).Source: Consumer Financial Protection Bureau, The Consumer Credit Card Market: Report to Congress, December 2025, checked October 13, 2026. CFPB analysis of credit bureau records and account data from large bank issuers, as of 2024.
- $160 billion
- Interest charges assessed on US credit card holders (2024).Source: Consumer Financial Protection Bureau, The Consumer Credit Card Market: Report to Congress, December 2025, checked October 13, 2026. CFPB analysis of credit bureau records and account data from large bank issuers, as of 2024.
- $31.3 billion
- Fees paid by US credit card holders (2024).Source: Consumer Financial Protection Bureau, The Consumer Credit Card Market: Report to Congress, December 2025, checked October 13, 2026. CFPB analysis of credit bureau records and account data from large bank issuers, as of 2024. Up 23 percent from $25.4 billion in 2022.
- $17 billion
- Late fees charged on credit cards (2024).Source: Consumer Financial Protection Bureau, The Consumer Credit Card Market: Report to Congress, December 2025, checked October 13, 2026. CFPB analysis of credit bureau records and account data from large bank issuers, as of 2024. Charged by issuers in the CFPB's Y-14+ data; $5.8 billion of it on private label cards.
- $8.7 billion
- Annual fees charged on credit cards (2024).Source: Consumer Financial Protection Bureau, The Consumer Credit Card Market: Report to Congress, December 2025, checked October 13, 2026. CFPB analysis of credit bureau records and account data from large bank issuers, as of 2024.
- $127
- Average annual fee on general purpose cards that charge one (2024).Source: Consumer Financial Protection Bureau, The Consumer Credit Card Market: Report to Congress, December 2025, checked October 13, 2026. CFPB analysis of credit bureau records and account data from large bank issuers, as of 2024. Only 16 percent of accounts in the CFPB's Y-14 data charged an annual fee.
- 68%
- Credit card holders who paid no credit card fees in the year (2025).Source: Federal Reserve Bank of Atlanta, 2025 Survey and Diary of Consumer Payment Choice: Summary Results (No. 26-1, May 2026), checked October 13, 2026. Atlanta Fed survey and payment diary of US consumers, October 2025.
- 8%
- Credit card holders who paid a late payment fee in the year (2025).Source: Federal Reserve Bank of Atlanta, 2025 Survey and Diary of Consumer Payment Choice: Summary Results (No. 26-1, May 2026), checked October 13, 2026. Atlanta Fed survey and payment diary of US consumers, October 2025.
How far above the Fed’s rate are card rates?
In August 2026 the average card APR on accounts charged interest was 18.73 percentage points above the Federal funds rate (22.36% against 3.63%). That is the widest gap since the card series began in November 1994. The narrowest was 8.49 percentage points, in May 2000.
The effective Federal funds rate is an overnight funding benchmark. It is not a measurement of a card issuer’s actual funding cost. The difference is a rate spread, not a profit margin: it does not deduct credit losses, operating expenses, rewards or other costs. This is our calculation, the difference between two published rates in the same month. The gap widens when the Fed’s rate falls faster than card rates do, as it did in 2008 and again in 2020. The credit card interest margin, measured against the prime rate as well, has its own page, with the monthly reading and a download, what it costs in each state has another, and so does how sampled cards compare with a 10% rate cap.
Source: Federal Reserve Board, G.19 Consumer Credit, series TERMCBCCINTNS; Federal Reserve Board, H.15 Selected Interest Rates, series FEDFUNDS, via FRED, saved October 13, 2026. Our calculation: the card rate minus the Federal funds rate for the same month.
Show the data (128 rows)
| Period | Percentage points |
|---|---|
| August 2026 | 18.73 |
| May 2026 | 18.52 |
| February 2026 | 17.88 |
| November 2025 | 18.42 |
| August 2025 | 18.50 |
| May 2025 | 17.92 |
| February 2025 | 17.58 |
| November 2024 | 18.16 |
| August 2024 | 18.04 |
| May 2024 | 17.45 |
| February 2024 | 17.30 |
| November 2023 | 17.42 |
| August 2023 | 17.44 |
| May 2023 | 17.10 |
| February 2023 | 16.35 |
| November 2022 | 16.62 |
| August 2022 | 16.10 |
| May 2022 | 15.88 |
| February 2022 | 16.09 |
| November 2021 | 16.36 |
| August 2021 | 17.04 |
| May 2021 | 16.24 |
| February 2021 | 15.83 |
| November 2020 | 16.19 |
| August 2020 | 16.33 |
| May 2020 | 15.73 |
| February 2020 | 15.03 |
| November 2019 | 15.33 |
| August 2019 | 14.84 |
| May 2019 | 14.75 |
| February 2019 | 14.51 |
| November 2018 | 14.66 |
| August 2018 | 14.55 |
| May 2018 | 13.84 |
| February 2018 | 13.90 |
| November 2017 | 13.83 |
| August 2017 | 13.73 |
| May 2017 | 13.09 |
| February 2017 | 13.20 |
| November 2016 | 13.20 |
| August 2016 | 13.36 |
| May 2016 | 12.98 |
| February 2016 | 13.13 |
| November 2015 | 13.58 |
| August 2015 | 13.79 |
| May 2015 | 13.37 |
| February 2015 | 13.42 |
| November 2014 | 13.59 |
| August 2014 | 13.09 |
| May 2014 | 12.65 |
| February 2014 | 13.07 |
| November 2013 | 12.81 |
| August 2013 | 13.03 |
| May 2013 | 12.65 |
| February 2013 | 12.87 |
| November 2012 | 12.65 |
| August 2012 | 13.08 |
| May 2012 | 12.60 |
| February 2012 | 12.94 |
| November 2011 | 12.70 |
| August 2011 | 12.98 |
| May 2011 | 12.97 |
| February 2011 | 13.28 |
| November 2010 | 13.48 |
| August 2010 | 14.03 |
| May 2010 | 14.28 |
| February 2010 | 14.54 |
| November 2009 | 14.25 |
| August 2009 | 14.74 |
| May 2009 | 14.25 |
| February 2009 | 13.32 |
| November 2008 | 12.97 |
| August 2008 | 11.64 |
| May 2008 | 11.53 |
| February 2008 | 10.79 |
| November 2007 | 9.89 |
| August 2007 | 10.22 |
| May 2007 | 9.22 |
| February 2007 | 9.38 |
| November 2006 | 9.84 |
| August 2006 | 9.42 |
| May 2006 | 9.83 |
| February 2006 | 9.89 |
| November 2005 | 10.49 |
| August 2005 | 11.25 |
| May 2005 | 11.81 |
| February 2005 | 11.63 |
| November 2004 | 11.99 |
| August 2004 | 12.17 |
| May 2004 | 11.93 |
| February 2004 | 11.41 |
| November 2003 | 11.93 |
| August 2003 | 12.10 |
| May 2003 | 11.63 |
| February 2003 | 10.70 |
| November 2002 | 11.44 |
| August 2002 | 11.55 |
| May 2002 | 11.61 |
| February 2002 | 11.26 |
| November 2001 | 11.81 |
| August 2001 | 11.02 |
| May 2001 | 10.44 |
| February 2001 | 9.14 |
| November 2000 | 8.75 |
| August 2000 | 8.87 |
| May 2000 | 8.49 |
| February 2000 | 8.57 |
| November 1999 | 9.36 |
| August 1999 | 9.73 |
| May 1999 | 10.20 |
| February 1999 | 9.97 |
| November 1998 | 10.90 |
| August 1998 | 10.29 |
| May 1998 | 10.21 |
| February 1998 | 9.83 |
| November 1997 | 10.22 |
| August 1997 | 10.25 |
| May 1997 | 10.22 |
| February 1997 | 9.96 |
| November 1996 | 10.21 |
| August 1996 | 10.44 |
| May 1996 | 10.09 |
| February 1996 | 10.20 |
| November 1995 | 9.94 |
| August 1995 | 10.16 |
| May 1995 | 10.25 |
| February 1995 | 9.36 |
| November 1994 | 10.48 |
What moving a balance like this to a card with a 0% or low intro rate would cost, card by card, is in our balance transfer calculator.
How many card balances are late or written off?
2.85% of credit card balances at US commercial banks were delinquent in Q2 2026, down 0.19 percentage points on a year earlier, and banks charged off 3.82% of card balances at an annual rate (down 0.37 percentage points). Both are well below their peaks after the 2008 financial crisis: delinquency reached 6.77% in Q2 2009 and charge-offs 10.54% in Q4 2009.
The Federal Reserve counts a loan as delinquent when it is 30 or more days past due, or no longer accruing interest. A charge-off is a balance the bank has written off as unlikely to be repaid, net of recoveries, as an annual rate. Both cover card loans held by commercial banks, seasonally adjusted.
- Delinquency rate (30+ days)
- Charge-off rate (annualized)
Source: Federal Reserve Board, Charge-Off and Delinquency Rates on Loans and Leases at Commercial Banks, series DRCCLACBS; Federal Reserve Board, Charge-Off and Delinquency Rates on Loans and Leases at Commercial Banks, series CORCCACBS, via FRED, saved October 13, 2026.
Show the data (166 rows)
| Period | Delinquency rate | Charge-off rate |
|---|---|---|
| Q2 2026 | 2.85 | 3.82 |
| Q1 2026 | 2.91 | 3.82 |
| Q4 2025 | 2.95 | 4.09 |
| Q3 2025 | 2.99 | 4.18 |
| Q2 2025 | 3.04 | 4.19 |
| Q1 2025 | 3.05 | 4.44 |
| Q4 2024 | 3.08 | 4.57 |
| Q3 2024 | 3.20 | 4.69 |
| Q2 2024 | 3.22 | 4.56 |
| Q1 2024 | 3.17 | 4.40 |
| Q4 2023 | 3.10 | 4.18 |
| Q3 2023 | 2.95 | 3.76 |
| Q2 2023 | 2.75 | 3.23 |
| Q1 2023 | 2.47 | 2.86 |
| Q4 2022 | 2.26 | 2.51 |
| Q3 2022 | 2.05 | 2.10 |
| Q2 2022 | 1.83 | 1.86 |
| Q1 2022 | 1.69 | 1.73 |
| Q4 2021 | 1.57 | 1.63 |
| Q3 2021 | 1.53 | 1.81 |
| Q2 2021 | 1.59 | 2.38 |
| Q1 2021 | 1.88 | 2.81 |
| Q4 2020 | 2.10 | 2.68 |
| Q3 2020 | 1.99 | 3.60 |
| Q2 2020 | 2.45 | 3.78 |
| Q1 2020 | 2.69 | 3.72 |
| Q4 2019 | 2.61 | 3.78 |
| Q3 2019 | 2.60 | 3.75 |
| Q2 2019 | 2.59 | 3.63 |
| Q1 2019 | 2.54 | 3.68 |
| Q4 2018 | 2.54 | 3.67 |
| Q3 2018 | 2.52 | 3.69 |
| Q2 2018 | 2.50 | 3.61 |
| Q1 2018 | 2.50 | 3.65 |
| Q4 2017 | 2.48 | 3.70 |
| Q3 2017 | 2.54 | 3.59 |
| Q2 2017 | 2.49 | 3.50 |
| Q1 2017 | 2.40 | 3.45 |
| Q4 2016 | 2.37 | 3.49 |
| Q3 2016 | 2.29 | 3.06 |
| Q2 2016 | 2.21 | 3.01 |
| Q1 2016 | 2.15 | 3.04 |
| Q4 2015 | 2.16 | 2.94 |
| Q3 2015 | 2.15 | 2.95 |
| Q2 2015 | 2.12 | 2.91 |
| Q1 2015 | 2.11 | 2.94 |
| Q4 2014 | 2.15 | 3.01 |
| Q3 2014 | 2.20 | 3.07 |
| Q2 2014 | 2.26 | 3.31 |
| Q1 2014 | 2.32 | 3.24 |
| Q4 2013 | 2.38 | 3.37 |
| Q3 2013 | 2.44 | 3.37 |
| Q2 2013 | 2.53 | 3.47 |
| Q1 2013 | 2.64 | 3.70 |
| Q4 2012 | 2.71 | 3.84 |
| Q3 2012 | 2.82 | 3.93 |
| Q2 2012 | 2.92 | 3.95 |
| Q1 2012 | 3.06 | 4.24 |
| Q4 2011 | 3.25 | 4.63 |
| Q3 2011 | 3.45 | 5.85 |
| Q2 2011 | 3.65 | 5.31 |
| Q1 2011 | 3.82 | 6.93 |
| Q4 2010 | 4.14 | 7.91 |
| Q3 2010 | 4.58 | 8.78 |
| Q2 2010 | 5.10 | 10.43 |
| Q1 2010 | 5.78 | 10.51 |
| Q4 2009 | 6.33 | 10.54 |
| Q3 2009 | 6.49 | 10.22 |
| Q2 2009 | 6.77 | 9.31 |
| Q1 2009 | 6.51 | 7.68 |
| Q4 2008 | 5.64 | 6.53 |
| Q3 2008 | 4.80 | 5.77 |
| Q2 2008 | 4.90 | 5.26 |
| Q1 2008 | 4.77 | 4.76 |
| Q4 2007 | 4.60 | 4.32 |
| Q3 2007 | 4.41 | 3.91 |
| Q2 2007 | 4.02 | 3.73 |
| Q1 2007 | 3.98 | 4.01 |
| Q4 2006 | 3.95 | 3.70 |
| Q3 2006 | 4.12 | 3.84 |
| Q2 2006 | 4.13 | 3.43 |
| Q1 2006 | 3.86 | 3.17 |
| Q4 2005 | 3.54 | 6.09 |
| Q3 2005 | 3.90 | 4.35 |
| Q2 2005 | 3.67 | 4.25 |
| Q1 2005 | 3.70 | 4.66 |
| Q4 2004 | 4.03 | 4.68 |
| Q3 2004 | 4.07 | 4.49 |
| Q2 2004 | 4.15 | 5.27 |
| Q1 2004 | 4.21 | 5.40 |
| Q4 2003 | 4.43 | 6.01 |
| Q3 2003 | 4.24 | 5.59 |
| Q2 2003 | 4.53 | 5.96 |
| Q1 2003 | 4.68 | 5.73 |
| Q4 2002 | 4.84 | 5.54 |
| Q3 2002 | 4.89 | 6.22 |
| Q2 2002 | 4.78 | 6.19 |
| Q1 2002 | 4.94 | 7.65 |
| Q4 2001 | 4.69 | 6.35 |
| Q3 2001 | 5.00 | 5.55 |
| Q2 2001 | 4.94 | 5.22 |
| Q1 2001 | 4.81 | 4.57 |
| Q4 2000 | 4.57 | 4.39 |
| Q3 2000 | 4.53 | 4.25 |
| Q2 2000 | 4.51 | 4.09 |
| Q1 2000 | 4.43 | 4.49 |
| Q4 1999 | 4.55 | 4.49 |
| Q3 1999 | 4.60 | 4.50 |
| Q2 1999 | 4.58 | 4.32 |
| Q1 1999 | 4.66 | 4.89 |
| Q4 1998 | 4.74 | 5.08 |
| Q3 1998 | 4.72 | 5.28 |
| Q2 1998 | 4.76 | 5.20 |
| Q1 1998 | 4.76 | 5.24 |
| Q4 1997 | 4.81 | 5.40 |
| Q3 1997 | 4.70 | 5.50 |
| Q2 1997 | 4.73 | 5.38 |
| Q1 1997 | 4.70 | 4.92 |
| Q4 1996 | 4.60 | 4.65 |
| Q3 1996 | 4.46 | 4.46 |
| Q2 1996 | 4.27 | 4.45 |
| Q1 1996 | 4.04 | 4.22 |
| Q4 1995 | 3.95 | 3.93 |
| Q3 1995 | 3.85 | 3.67 |
| Q2 1995 | 3.70 | 3.27 |
| Q1 1995 | 3.48 | 2.93 |
| Q4 1994 | 3.29 | 3.08 |
| Q3 1994 | 3.25 | 2.97 |
| Q2 1994 | 3.29 | 3.02 |
| Q1 1994 | 3.60 | 3.31 |
| Q4 1993 | 3.91 | 3.34 |
| Q3 1993 | 4.08 | 3.69 |
| Q2 1993 | 4.46 | 3.95 |
| Q1 1993 | 4.60 | 4.10 |
| Q4 1992 | 4.69 | 4.47 |
| Q3 1992 | 4.98 | 4.34 |
| Q2 1992 | 5.10 | 4.78 |
| Q1 1992 | 5.27 | 4.91 |
| Q4 1991 | 5.32 | 4.59 |
| Q3 1991 | 5.35 | 4.83 |
| Q2 1991 | 5.48 | 4.60 |
| Q1 1991 | 5.26 | 4.18 |
| Q4 1990 | – | 3.79 |
| Q3 1990 | – | 3.55 |
| Q2 1990 | – | 3.21 |
| Q1 1990 | – | 3.10 |
| Q4 1989 | – | 3.21 |
| Q3 1989 | – | 3.07 |
| Q2 1989 | – | 3.16 |
| Q1 1989 | – | 3.13 |
| Q4 1988 | – | 3.12 |
| Q3 1988 | – | 3.21 |
| Q2 1988 | – | 3.24 |
| Q1 1988 | – | 3.18 |
| Q4 1987 | – | 3.21 |
| Q3 1987 | – | 3.16 |
| Q2 1987 | – | 3.34 |
| Q1 1987 | – | 3.45 |
| Q4 1986 | – | 3.39 |
| Q3 1986 | – | 3.39 |
| Q2 1986 | – | 3.20 |
| Q1 1986 | – | 3.13 |
| Q4 1985 | – | 2.91 |
| Q3 1985 | – | 2.67 |
| Q2 1985 | – | 2.26 |
| Q1 1985 | – | 1.90 |
Who has credit cards, and how do they pay?
These figures come from surveys and reports, quoted from saved copies of each document. Each states its own population and year, so read them as describing that group in that period. Younger and lower-income adults are the least likely to have a card; if you’re getting your first, see the best first credit cards and the best student credit cards.
- 82%
- US adults who had a credit card (2025).Source: Federal Reserve Board, Economic Well-Being of U.S. Households in 2025 (SHED), May 2026, checked October 13, 2026. Federal Reserve survey of US adults, fielded in October 2025. The Atlanta Fed survey puts card adoption at 80 percent of consumers for the same year.
- 65%
- Adults aged 18 to 29 who had a credit card (2025).Source: Federal Reserve Board, Economic Well-Being of U.S. Households in 2025 (SHED), May 2026, checked October 13, 2026. Federal Reserve survey of US adults, fielded in October 2025. Table 40, row 18–29; columns: has a credit card (65), carried a balance among card holders (46), carried a balance among all adults (30).
- 92%
- Adults aged 60 and over who had a credit card (2025).Source: Federal Reserve Board, Economic Well-Being of U.S. Households in 2025 (SHED), May 2026, checked October 13, 2026. Federal Reserve survey of US adults, fielded in October 2025. Table 40, row 60+; columns: has a credit card (92), carried a balance among card holders (36), carried a balance among all adults (33).
- 46%
- Adults with family income under $25,000 who had a credit card (2025).Source: Federal Reserve Board, Economic Well-Being of U.S. Households in 2025 (SHED), May 2026, checked October 13, 2026. Federal Reserve survey of US adults, fielded in October 2025. Table 40, row "Less than $25,000"; columns: has a credit card (46), carried a balance among card holders (52), carried a balance among all adults (24).
- 97%
- Adults with family income of $100,000 or more who had a credit card (2025).Source: Federal Reserve Board, Economic Well-Being of U.S. Households in 2025 (SHED), May 2026, checked October 13, 2026. Federal Reserve survey of US adults, fielded in October 2025. Table 40, row "$100,000 or more"; columns: has a credit card (97), carried a balance among card holders (37), carried a balance among all adults (36).
- 80%
- US consumers who had at least one credit card (2025).Source: Federal Reserve Bank of Atlanta, 2025 Survey and Diary of Consumer Payment Choice: Summary Results (No. 26-1, May 2026), checked October 13, 2026. Atlanta Fed survey and payment diary of US consumers, October 2025. The SHED, a different survey, puts it at 82 percent of adults.
- 23%
- Credit card holders with five or more credit cards (2025).Source: Federal Reserve Bank of Atlanta, 2025 Survey and Diary of Consumer Payment Choice: Summary Results (No. 26-1, May 2026), checked October 13, 2026. Atlanta Fed survey and payment diary of US consumers, October 2025.
- 208 million
- American consumers with a credit card (Year-end 2023).Source: Consumer Financial Protection Bureau, The Consumer Credit Card Market: Report to Congress, December 2025, checked October 13, 2026. CFPB analysis of its Consumer Credit Information Panel of credit records, at the end of 2023. 78 percent of 267 million US adult residents. Counts people with a card account in their name, not survey answers.
- 195 million
- Consumers with a general purpose credit card (Year-end 2023).Source: Consumer Financial Protection Bureau, The Consumer Credit Card Market: Report to Congress, December 2025, checked October 13, 2026. CFPB analysis of its Consumer Credit Information Panel of credit records, at the end of 2023. A consumer with both kinds of card is counted once in each.
- 105 million
- Consumers with a private label (store) credit card (Year-end 2023).Source: Consumer Financial Protection Bureau, The Consumer Credit Card Market: Report to Congress, December 2025, checked October 13, 2026. CFPB analysis of its Consumer Credit Information Panel of credit records, at the end of 2023. A consumer with both kinds of card is counted once in each.
- 45%
- Credit card holders who carried a balance at least once in the prior 12 months (2025).Source: Federal Reserve Board, Economic Well-Being of U.S. Households in 2025 (SHED), May 2026, checked October 13, 2026. Federal Reserve survey of US adults, fielded in October 2025. The sentence continues in the report: "card owners said they carried a balance at least once during the prior 12 months".
- 63%
- Adults who would cover a $400 emergency expense with cash, savings or a card paid off at the next statement (2025).Source: Federal Reserve Board, Economic Well-Being of U.S. Households in 2025 (SHED), May 2026, checked October 13, 2026. Federal Reserve survey of US adults, fielded in October 2025.
- 15%
- General purpose cardholders who made only the minimum payment (2024).Source: Consumer Financial Protection Bureau, The Consumer Credit Card Market: Report to Congress, December 2025, checked October 13, 2026. CFPB analysis of credit bureau records and account data from large bank issuers, as of 2024. For private label cardholders the figure was 20 percent.
- 50%
- Credit card accounts that revolve a balance (2024).Source: Consumer Financial Protection Bureau, The Consumer Credit Card Market: Report to Congress, December 2025, checked October 13, 2026. CFPB analysis of credit bureau records and account data from large bank issuers, as of 2024. The CFPB gives this as "around 50 percent" of accounts, not people.
- 42%
- Credit card holders who revolved a balance in the month ending October 2025.Source: Federal Reserve Bank of Atlanta, 2025 Survey and Diary of Consumer Payment Choice: Summary Results (No. 26-1, May 2026), checked October 13, 2026. Atlanta Fed survey and payment diary of US consumers, October 2025.
How common is credit card fraud?
The surveys below measure people who say they experienced fraud. The FTC figure counts identity-theft reports, while the CFPB dispute figure counts dollars. These are different measures: reports are not unique victims, disputed charges are not necessarily fraud, and neither is a measure of total fraud losses. What the law caps your loss at, and where card fraud happens, is in our credit card security guide.
- 16%
- US adults who experienced fraud involving their credit card (2025).Source: Federal Reserve Board, Economic Well-Being of U.S. Households in 2025 (SHED), May 2026, checked October 13, 2026. Federal Reserve survey of US adults, fielded in October 2025. Share of all adults, not only card holders. The sentence continues "credit card".
- 10%
- Credit card holders who reported credit card fraud (2025).Source: Federal Reserve Bank of Atlanta, 2025 Survey and Diary of Consumer Payment Choice: Summary Results (No. 26-1, May 2026), checked October 13, 2026. Atlanta Fed survey and payment diary of US consumers, October 2025. Share of card holders, so not comparable with the SHED figure for all adults.
- 2,128,094
- Credit card identity theft reports submitted to the FTC over five years (2020–2024).Source: Consumer Financial Protection Bureau, The Consumer Credit Card Market: Report to Congress, December 2025, checked October 13, 2026. CFPB report, Table 4, analysing the FTC’s Identity Theft Reports data: credit card was the most reported theft type, 28 percent of all identity theft reports over 2020–2024. Reports, not victims or losses.
- $9.8 billion
- Credit card charges disputed by cardholders (2024).Source: Consumer Financial Protection Bureau, The Consumer Credit Card Market: Report to Congress, December 2025, checked October 13, 2026. CFPB analysis of credit bureau records and account data from large bank issuers, as of 2024. Not all disputes are fraud: on general purpose cards the most common reason was a cancelled recurring transaction, 40 percent of disputes.
How much is spent on credit cards, and what do rewards pay back?
These figures come from the CFPB’s report to Congress. Coverage varies by statistic, including consumer credit cards overall and general purpose accounts in participating issuers’ data. Each states the year it describes. To see what rewards would be worth on your own spending, use our credit card comparison, or start with the best credit cards for groceries.
- $3.60 trillion
- Purchase volume on US consumer credit cards (2024).Source: Consumer Financial Protection Bureau, The Consumer Credit Card Market: Report to Congress, December 2025, checked October 13, 2026. CFPB analysis of credit bureau records and account data from large bank issuers, as of 2024.
- $899 billion
- Purchase volume on credit cards with a zero percent introductory APR promotion (2024).Source: Consumer Financial Protection Bureau, The Consumer Credit Card Market: Report to Congress, December 2025, checked October 13, 2026. CFPB analysis of credit bureau records and account data from large bank issuers, as of 2024.
- $47.5 billion
- Credit card rewards earned by consumers on general purpose cards (2024).Source: Consumer Financial Protection Bureau, The Consumer Credit Card Market: Report to Congress, December 2025, checked October 13, 2026. CFPB analysis of credit bureau records and account data from large bank issuers, as of 2024. Points cards earned $23.9 billion, cash back cards $16.6 billion and miles cards $6.6 billion.
What do card terms look like?
We record every US card we track from the issuer’s own published terms: 141 cards from 28 issuers, checked automatically between October 4, 2026 and October 22, 2026. These counts are across those cards, not the whole US market, and each moves when a card’s terms change. How we record and compare cards
- 70.2%
- have no annual fee (99 of 141).Where a fee is charged, the median is $95 and the highest $895.
- 28.49%
- is the median top of the published purchase APR range (137 cards).Median bottom of the range: 19.49%. Lowest and highest published: 10.24% and 35.99%.
- 64.1%
- charge no foreign transaction fee (82 of the 128 that state one).For trips abroad, see the best travel credit cards.
- 61
- cards offer an intro APR on balance transfers, the longest for 21 months.39 offer one on purchases, the longest for 21 months.
- 63
- cards pay cash back, 13 pay points or miles, and 25 pay no rewards.For 40 more, the issuer publishes a rewards program we haven’t valued yet.
- 20
- are secured cards, which need a deposit and are built for people new to credit or rebuilding it.
Source: our records of 137 cards, from each issuer’s published terms. Each card counts equally; these are not weighted by account numbers or balances. Each bar counts cards whose highest published purchase APR falls in that 2-point band (lower bound included).
Show the data
| Top APR | Cards |
|---|---|
| 16% to under 18% | 4 |
| 18% to under 20% | 6 |
| 20% to under 22% | 0 |
| 22% to under 24% | 1 |
| 24% to under 26% | 9 |
| 26% to under 28% | 42 |
| 28% to under 30% | 63 |
| 30% to under 32% | 0 |
| 32% to under 34% | 8 |
| 34% to under 36% | 4 |
Compare every card we have checked by what it is worth to you after fees, or see the best no annual fee credit cards.
Why do credit card debt totals disagree?
Two official sources measure US card debt, and they give different totals because they count different things. The New York Fed put credit card balances at $1.26 trillion in Q2 2026; the Federal Reserve’s G.19 put revolving credit at $1.35 trillion in August 2026.
| Federal Reserve G.19 | New York Fed Household Debt and Credit | |
|---|---|---|
| Latest total | $1.35 trillion (August 2026) | $1.26 trillion (Q2 2026) |
| What it measures | Revolving consumer credit: mostly credit card loans, plus other revolving lines such as overdraft plans | Credit card balances on consumers’ credit reports |
| Where the data comes from | Lenders’ balance sheets, including securitized loans | A sample of Equifax credit reports |
| How often | Monthly, seasonally adjusted | Quarterly, not seasonally adjusted |
Neither total is only debt that costs interest: both include balances that will be paid in full when the statement arrives. When a source quotes “average credit card debt per household”, check which total it divided, and by how many households or cardholders: the answer changes with both.
Choose the right credit card statistic
| Measure | What it answers | What it does not tell you |
|---|---|---|
| Revolving consumer credit | How much revolving credit lenders report outstanding, mostly on credit cards. | How much is accruing interest, or how much each household owes. |
| APR on accounts assessed interest | The average rate for interest-bearing accounts in the Fed’s bank survey. | The advertised rate for a new application or an individual borrower’s APR. |
| Median top of the published APR range | The middle of the highest purchase APRs card issuers publish in our sample, with each card counted equally. | A balance-weighted market average, or the share of people paying that rate. |
| Delinquency stock | The share of balances already late at a point in time. | The share newly becoming late during the quarter, or the share of people missing payments. |
| Delinquency flow | The share of balances moving into a specified late-payment category over a period. | The total share already in that category. Annualized flows are not a quarterly headcount. |
| Net charge-off rate | Balances written off, after recoveries, expressed at an annual rate. | The share of borrowers who defaulted, or losses incurred over a whole year from one quarter alone. |
| Mean versus median balance | The mean divides total balances by the population; the median is the middle person’s balance. | An interchangeable “typical debt” figure. Always retain the population and whether non-borrowers are included. |
Definitions follow the G.19 revolving credit series, G.19 interest-bearing APR series, bank delinquency series, and bank charge-off series. Report-specific populations are stated beside each figure above.
Why a higher total does not prove households are worse off
Nominal balances do not adjust for prices, population, income or credit access. A higher average can also hide very different experiences across borrowers. Use the inflation chart for price changes, the payment surveys for behavior, and delinquency measures for repayment stress.
Sources, method and the data
Every week an automated job downloads each official series below from FRED, the Federal Reserve Bank of St. Louis’s data service, and saves a new dated copy only when the data has changed; the same job re-checks our card records and publishes the result in our change log. The charts read the newest copy. Report figures are quoted from saved copies of each document, and a test checks every quote is in its copy. Counts of card terms come from our own card records. How we check every figure
| Series | What it measures | Units | From | Latest | Saved |
|---|---|---|---|---|---|
| REVOLSL | Revolving Consumer Credit Owned and Securitized (Federal Reserve Board, G.19 Consumer Credit) | Millions of Dollars, Seasonally Adjusted | January 1968 | 1,352,414 (August 2026) | October 13, 2026 |
| TERMCBCCALLNS | Commercial Bank Interest Rate on Credit Card Plans, All Accounts (Federal Reserve Board, G.19 Consumer Credit) | Percent, Not Seasonally Adjusted | November 1994 | 21.19 (August 2026) | October 13, 2026 |
| TERMCBCCINTNS | Commercial Bank Interest Rate on Credit Card Plans, Accounts Assessed Interest (Federal Reserve Board, G.19 Consumer Credit) | Percent, Not Seasonally Adjusted | November 1994 | 22.36 (August 2026) | October 13, 2026 |
| DRCCLACBS | Delinquency Rate on Credit Card Loans, All Commercial Banks (Federal Reserve Board, Charge-Off and Delinquency Rates on Loans and Leases at Commercial Banks) | Percent, Seasonally Adjusted | January 1991 | 2.85 (April 2026) | October 13, 2026 |
| CORCCACBS | Charge-Off Rate on Credit Card Loans, All Commercial Banks (Federal Reserve Board, Charge-Off and Delinquency Rates on Loans and Leases at Commercial Banks) | Percent, Seasonally Adjusted | January 1985 | 3.82 (April 2026) | October 13, 2026 |
| FEDFUNDS | Federal Funds Effective Rate (Federal Reserve Board, H.15 Selected Interest Rates) | Percent, Not Seasonally Adjusted | July 1954 | 3.75 (September 2026) | October 13, 2026 |
| CPIAUCSL | Consumer Price Index for All Urban Consumers: All Items in U.S. City Average (U.S. Bureau of Labor Statistics, Consumer Price Index) | Index 1982-1984=100, Seasonally Adjusted | January 1947 | 336.298 (September 2026) | October 15, 2026 |
Download every series as one CSV file. The download contains original observations, not the inflation-adjusted calculations. Cite the Federal Reserve Board for its series and the Bureau of Labor Statistics for CPI, retrieved via FRED. If you use our card-terms counts, please cite and link to this page.
Reports quoted on this page
- Federal Reserve Board, Economic Well-Being of U.S. Households in 2025 (SHED), May 2026, checked October 13, 2026
- Federal Reserve Bank of Atlanta, 2025 Survey and Diary of Consumer Payment Choice: Summary Results (No. 26-1, May 2026), checked October 13, 2026
- Consumer Financial Protection Bureau, The Consumer Credit Card Market: Report to Congress, December 2025, checked October 13, 2026
- Federal Reserve Bank of New York, Quarterly Report on Household Debt and Credit 2026:Q2 (press release, August 2026), checked October 13, 2026
Use and cite these statistics
Include the observation period, population and original publisher when quoting a figure. A page update date is not the period the statistic measures.
Board of Governors of the Federal Reserve System, credit card APR on accounts assessed interest: 22.36%, August 2026, via FRED; compiled by BestCreditCards.
For our calculations and card-sample findings, cite BestCreditCards, Credit card statistics and identify the calculation or sample. The official data sources remain credited to their publishers.
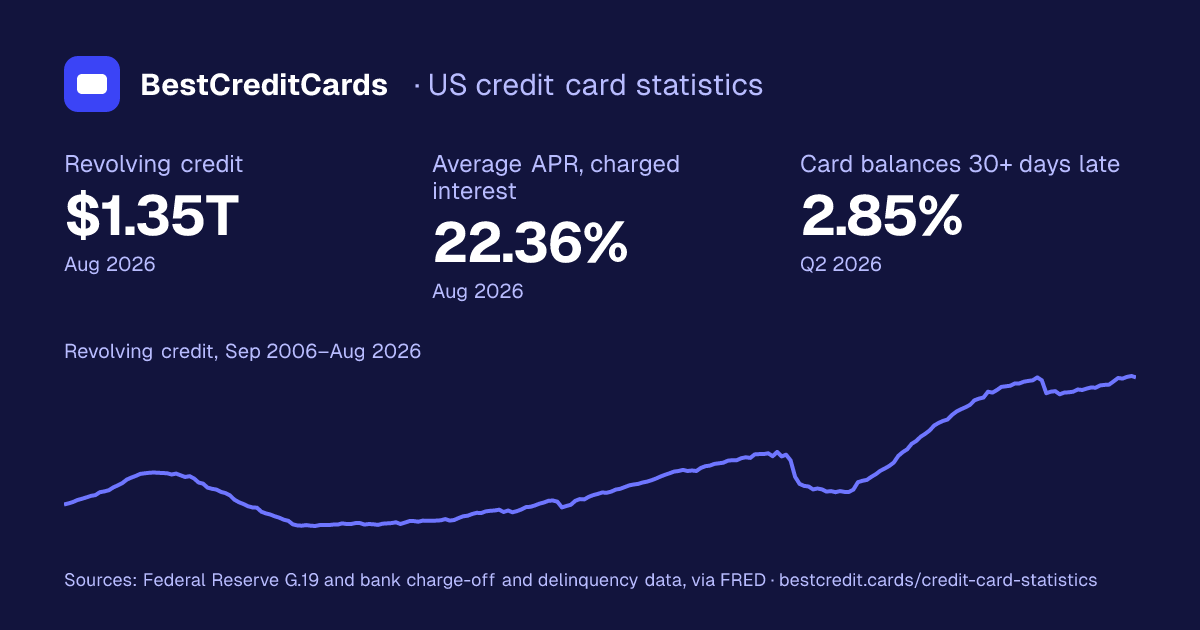
Embed this image
<a href="https://bestcredit.cards/credit-card-statistics"><img src="https://bestcredit.cards/credit-card-statistics/chart.png" width="1200" height="630" style="max-width:100%;height:auto" alt="Credit card statistics: US revolving credit of $1.35 trillion (Aug 2026), an average APR of 22.36% on accounts charged interest and 2.85% of bank card balances 30+ days late (Q2 2026), with a 20-year chart of revolving credit"></a>
<p>Source: <a href="https://bestcredit.cards/credit-card-statistics">BestCreditCards</a>, from Federal Reserve data.</p>
Journalists can find related studies in our press room. For a suspected error, contact the editor; published corrections appear in our corrections log.
What changed in this edition
October 28, 2026: an accuracy check of every figure against its source. The CFPB’s counts of people with credit cards (208, 195 and 105 million) are from the end of 2023, not 2024. We corrected our description of how the Federal Reserve calculates its card rates and of what the two debt totals include, renamed our median APR figure to say what it measures, and clarified that the widest card-rate gap is the widest since the series began. The interest calculator now starts from the Atlanta Fed’s mean balance among people who carry one, in place of an unexplained $6,000. Every other figure matched its source. See our corrections log.
October 22, 2026: added average credit card debt per person by state (New York Fed) with a state map, a key figure for it, and an embeddable image of the key statistics. The two monthly revolving-credit tables now show December of each year and the latest month; every month remains in the CSV.
October 20, 2026: added completed-year comparisons, inflation-adjusted revolving balances, definitions and citation guidance. Corrected the statistics download link and clarified fraud coverage and the funding-rate spread. Historical source values were not relabeled as newly collected observations.
Approved for publication by Matt Woodley on October 13, 2026. Data last changed October 28, 2026. Official series are re-downloaded weekly; report figures are quoted from saved copies and checked automatically. How we check every figure